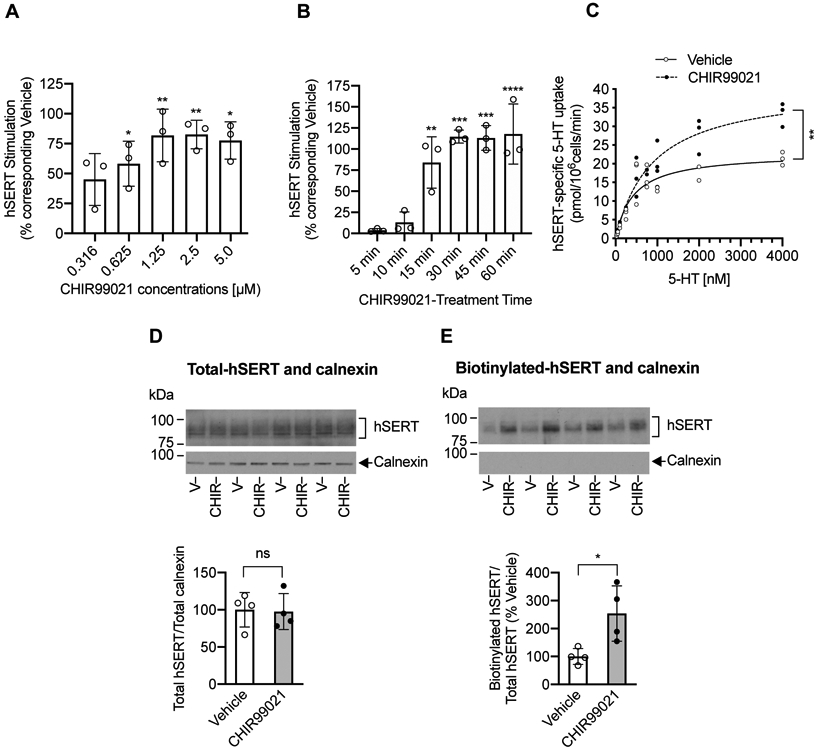
FIGURE 3. Effect of GSKα/ß inhibitor CHIR99021 on hSERT-mediated 5-HT uptake, hSERT kinetics, and hSERT surface expression in HEK-293 cells.

(A and B). Effect of CHIR99021 dose and treatment time on 5HT uptake. HEK-293 cells were transfected with hSERT-WT. After 24 h transfection, cells were preincubated at 37°C for 45 min with vehicle or various concentrations of CHIR99021 (A) or preincubated at 37°C with vehicle or CHIR99021 (2.5 μM) for various times (B). Following preincubation, hSERT-specific [3H]5-HT uptake was performed, and presented as percentage change of 5-HT uptake from the corresponding vehicle treated controls (mean ± SD). Vehicle-treated; N=3 and CHIR99021 treated; N=3 represents each independent cell culture preparations by averaging two or three replicates. (A). CHIR99021 pretreatment stimulates hSERT activity in a dose-dependent manner (one-way ANOVA: F(5.12) = 6.589, P =0.0036). Bonferroni’s multiple comparison test: *P =0.0240 (0.625 μM), **P =0.0020 (1.25 μM), **P =0.0019 (2.5 μM), *P =0.0125 (5 μM) compared with vehicle. (B). CHIR99021 stimulates SERT activity in a time-dependent manner (two-way ANOVA: time, F(4,8) = 15.13, P =0.0008; treatment, F(1,2) = 175.9, P =0.0056; time and treatment interaction (F(4,8) = 10.24, P =0.0031). Bonferroni’s multiple comparison test: **P =0.022 (15 min), *** P =0.0001 (30 min), ***P =0.0001 (45 min), ****P <0.0001 (60 min) compared with vehicle. (C). Effect of CHIR99021 on hSERT kinetics in HEK-293 cells. HEK-293 cells expressing hSERT-WT were treated with vehicle or CHIR99021 (2.5 μM) for 45 min at 37°C. Following treatments, hSERT specific [3H]5-HT uptake was measured using various concentrations of 5-HT. Nonlinear curve fits of uptake data were shown. Each point represents data from one independent cell culture preparation performed in duplicates. **P =0.0096 (t-test, N=3 independent experiments) compared with vehicle. Due to very close values, some data points got merged. (D and E). Effect of CHIR99021 on surface SERT. After 24 h post transfection of hSERT-WT, cells were treated with vehicle or CHIR99021 (2.5 μM) for 45 min at 37°C and cell surface biotinylation was performed. Representative immunoblots of four independent experiments show total (D) and biotinylated hSERT (E) as well as intracellular marker calnexin under each SERT respective immunoblot. Quantified total hSERT (~94-98 kDa) normalized to total calnexin (90 kDa) and quantified biotinylated hSERT normalized to total hSERT were shown under respective immunoblots (mean ± SD). CHIR99021 treated samples (N=4) are shown relative to vehicle-treated samples (N=4) samples and represent each independent cell culture preparations. Student’s t-test: *P =0.0245 compared with vehicle, ns: non-significant effect (P =0.8879) compared with vehicle. V: Vehicle, CHIR: CHIR99021.
