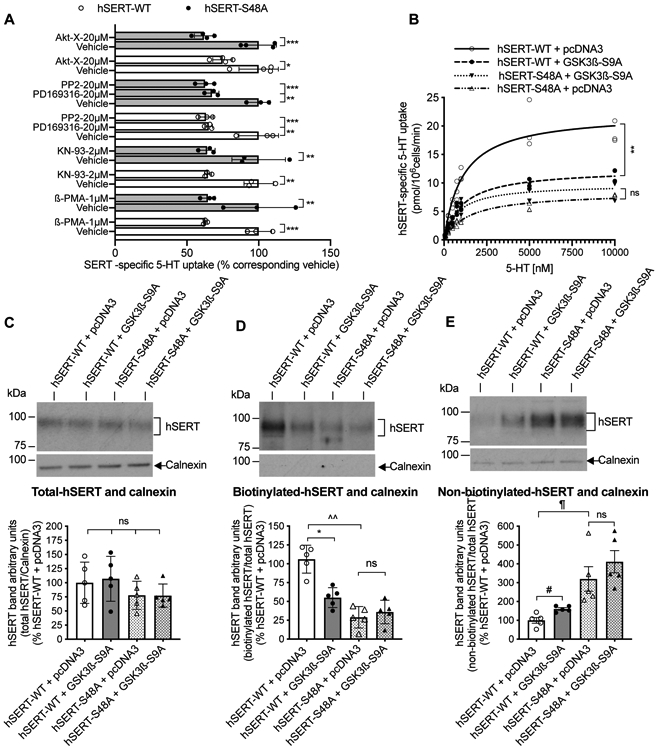
FIGURE 5. Effect of kinase modulators, and active GSK3ß co-expression on 5-HT transport, kinetics and surface expression of hSERT-WT and hSERT-S48A in HEK-293 cells.

(A). HEK-293 cells expressing hSERT-WT or hSERT-S48A were pretreated with indicated concentration of kinase modulators (Y-axis) for 30 min and [3H]5-HT uptake was measured for 10 min at 37°C. Kinase modulators significantly decreased 5-HT uptake in both hSERT-WT and hSERT-S48A (one-way ANOVA: F(17,40) = 9.302, P <0.0001). Bonferroni’s multiple comparison test: *P =0.0138, **P =0.0014, 0.001, 0.0017, 0.0040, ***P =0.0007, 0.0008 compared with respective vehicle. Mean ± SD, N=3 independent cell culture preparations performed in triplicate. (B). HEK-293 cells were co-transfected with hSERT-WT + pcDNA3 or hSERT-WT + GSK3ß-S9A or hSERT-S48A + pcDNA3 or hSERT-S48A + GSK3ß-S9A. After 24 h transfection, hSERT specific 5-HT uptake was measured using various concentrations of 5-HT. Nonlinear curve fits of uptake data were shown from (N=3); each data point represents an individual independent cell culture preparation by averaging two or three replicates. Due to very close values, some data points got merged. Co-expression of GSK3ß-S9A significantly decreased Vmax of hSERT-WT and had no effect on the Vmax of hSERT-S48A (two-way repeated measures (RM) ANOVA: interactions: F(1,4) = 44.02, P =0.0027, pcDNA3 vs GSK3ß-S9A: F(1,4) = 22.50, P =0.0090, hSERT-WT vs hSERT-S48A: F(1,4) = 90.15, P =0.04823). Bonferroni’s multiple comparison test: **P =0.0020 compared between hSERT-WT + GSK3ß-S9A and hSERT-WT + pcDNA3. ns. non-significant (P =0.5070) compared between hSERT-S48A + GSK3ß-S9A and hSERT-S48A + pcDNA3. (C-E). Representative immunoblots of independent cell culture preparations show total hSERT (C), biotinylated surface hSERT (D), and non-biotinylated intracellular hSERT (E). Intracellular marker calnexin from total extract, biotinylated and non-biotinylated fractions are also shown under each respective SERT immunoblot. Quantified bands densities (~94-98 kDa) of total hSERT normalized to total calnexin (90 kDa), biotinylated hSERT normalized to total hSERT, and non-biotinylated hSERT normalized to total hSERT are presented under respective immunoblots. *P =0.0198, ^^P =0.0044, #P =0.0423, ¶P =0.0428 compared between specified pairs. ns: non-significant effect between indicated pairs (paired Student’s t-test, N=5, mean ± SD).
