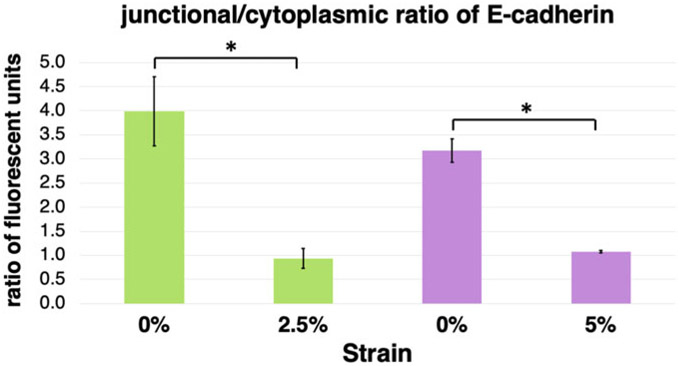
Fig. 4.
The ratio of junctional vs cytoplasmic E-cadherin localization is decreased upon application of strain in Caco2 cells. Graphical representation of the E-cadherin junctional and cytoplasmic immunofluorescence quantification of Caco2 cells under different conditions of strain presented in Table 1. Upon application of strain, the ratio of junctional to cytoplasmic localization of E-cadherin is significantly reduced (n = 3 representative fields; mean ± standard deviation; *P < 0.05, student’s t-test)

