
Fig. 3.
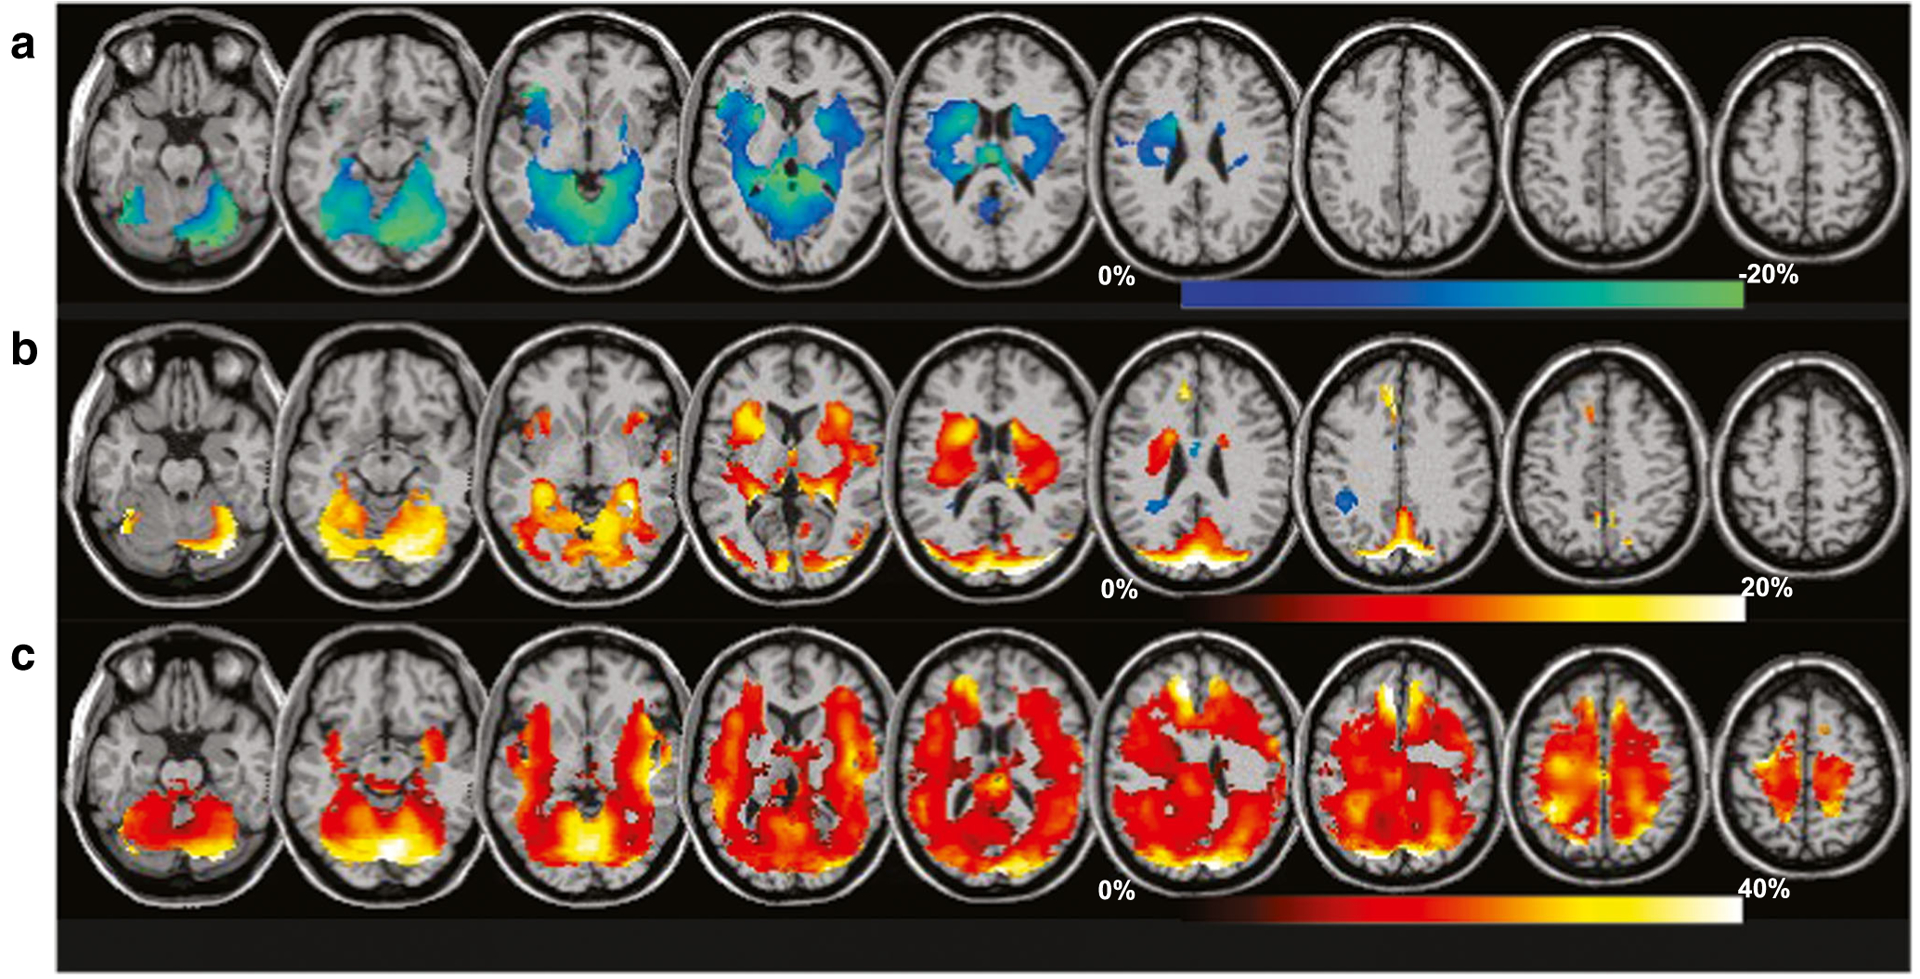
Percent differences of the group mean metabolite measures relative to control values for a group with moderate TBI (mean GCS 12.9, range 6 to 15). Regions with significant differences, for p < 0.05, are shown as a color overlay superimposed on the spatial reference magnetic resonance imaging. Results are shown for N-acetyl-aspartate/creatine (a), creatine (b), and choline (c), with the corresponding color scales indicated for each. Data was acquired at 3 T using a volumetric MRSI sequence with spatial sampling of 50×50×18 points over 280×280×180 mm3 and TE = 70 ms (modified from Maudsley et al. 2015)