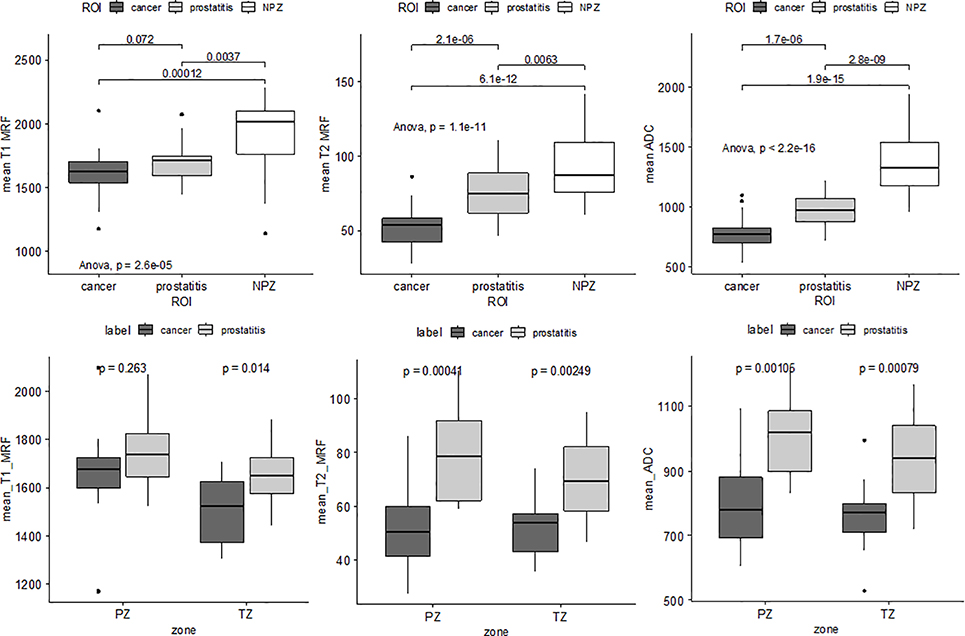
Figure 4:
Top row: Box plots illustrating statistically significant differences between prostate cancer prostatitis and normal peripheral zone (NPZ) in terms of mean T1, T2 MRF and ADC values, pair-wise along with ANOVA. Bottom row: Differences between prostate cancer and prostatitis in terms of mean T1, T2 MRF and ADC. T2 MRF and ADC show significant differences across peripheral (PZ) and transition zone (TZ) while T1 MRF is significantly different in the TZ, between prostate cancer and prostatitis.

