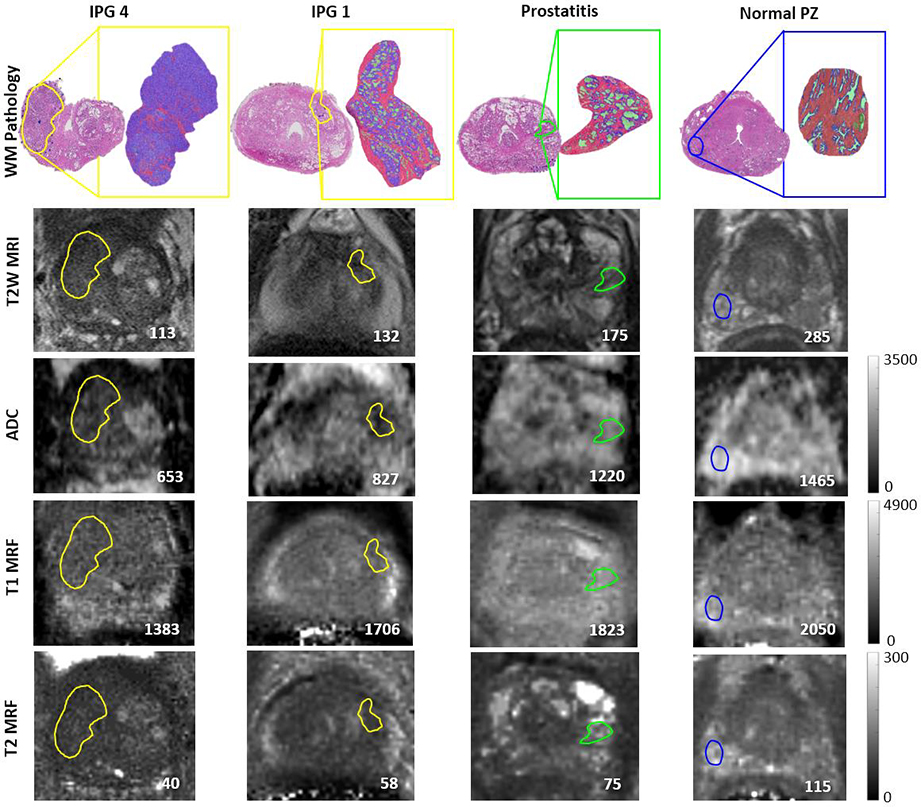
Figure 5:

Row 1: Tissue compartment segmentations on clinically significant (IPG >1), insignificant (IPG = 1), prostatitis and normal peripheral zone ROIs (purple epithelium, pink stroma and green lumen). Row 2,3: T2WI and ADC containing mapped ROIs from pathology. Row 4,5: T1, T2 MRF maps showing ROI mapped from T2WI. Mean values within the ROIs are provided in the lower right corner for each image.
