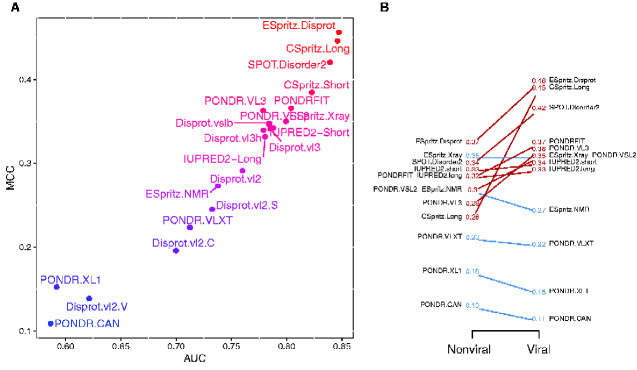
Figure 1.
Performance of predictors on viral data set. (A) Scatterplot of MCC and AUC values for 21 predictors applied to the viral protein data set. (B) Slopegraph comparing the MCC values for 13 predictors applied to both non-viral and viral data sets. Because the three variants of the ESpritz model obtained identical MCC values, the corresponding labels were merged. Two labels (PONDRFIT, PONDR.VSL2) were displaced to prevent overlaps on the left and right sides, respectively.

