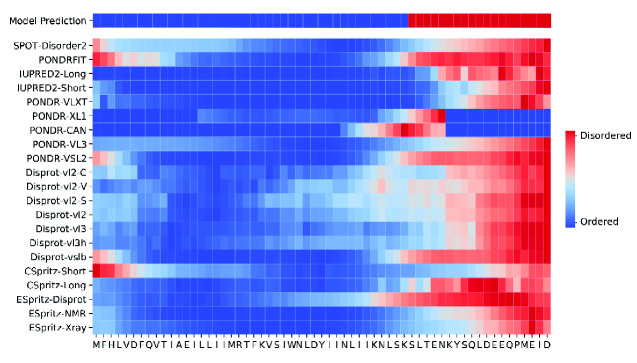
Figure 4.
Disorder predictions for novel ORF6 in SARS-CoV-2. The first row represents the random forest model predictions, with subsequent rows corresponding to individual predictors. The entire protein length is represented on the x-axis, each grid is an amino acid. Red squares indicate disordered predictions and blue squares indicate ordered predictions.

