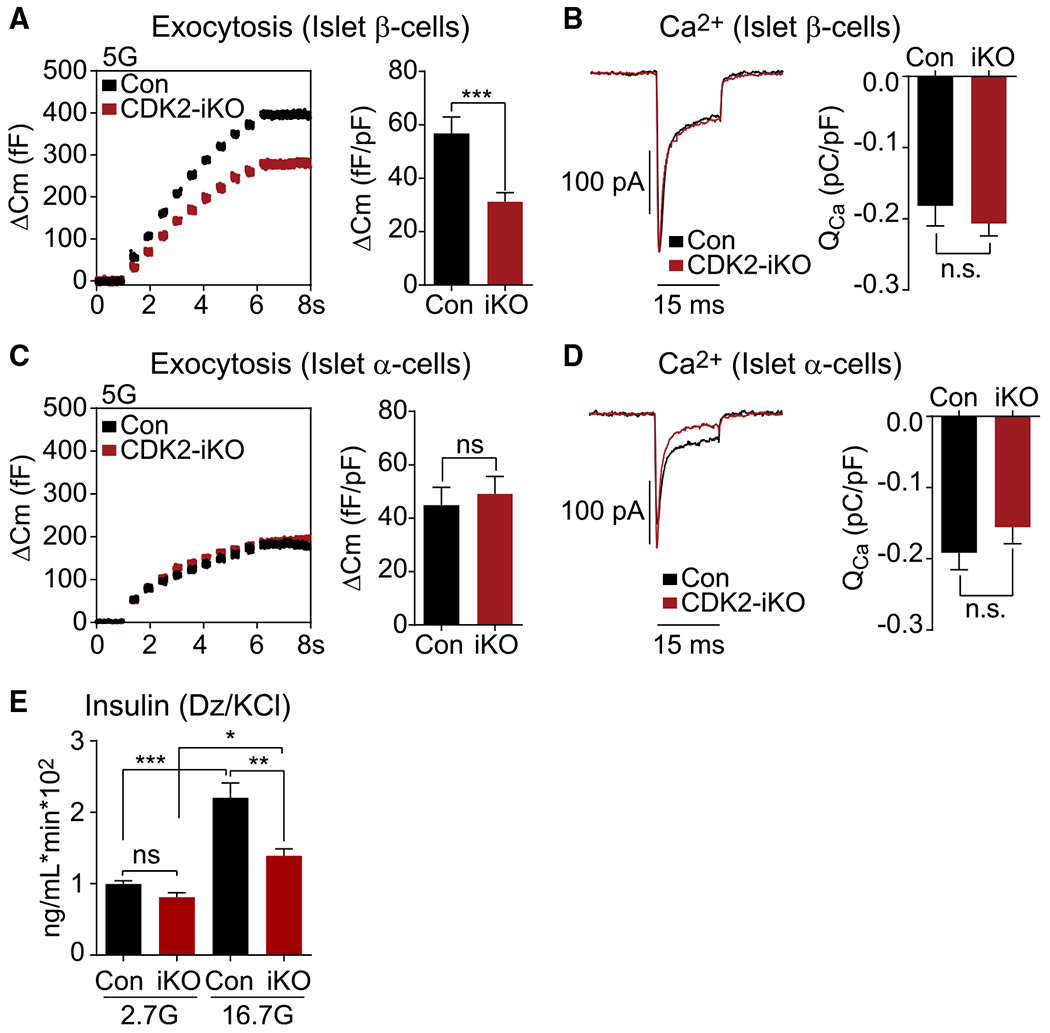
Figure 2. Reduced metabolic amplifying pathway in CDK2-iKO β cells.

(A and C) Capacitance increases in response to 10 step depolarizations from −70 mV to 0 mV in (A) β cells (Con, n = 19; CDK2-iKO, n = 39) and (C) α cells (Con, n = 14; CDK2-iKO, n = 14) isolated from 4 Con and 3 CDK2-iKO mice.
(B and D) Averaged leak-subtracted calcium current (Ica) and influx (Qca) from β cells (B) and α cells (D), measured during a 15-ms step depolarization from −70 mV to 0 mV for each cell above.
(E) Ex vivo KCl-stimulated insulin secretion normalized to DNA content, measured in isolated islets from Con (n = 3) and CDK2-iKO (n = 4) mice, quantified by AUC.
Data are shown as mean ± SEM. *p < 0.05, **p < 0.01, ***p < 0.001 by t test (B and D) or one-way ANOVA (E).
