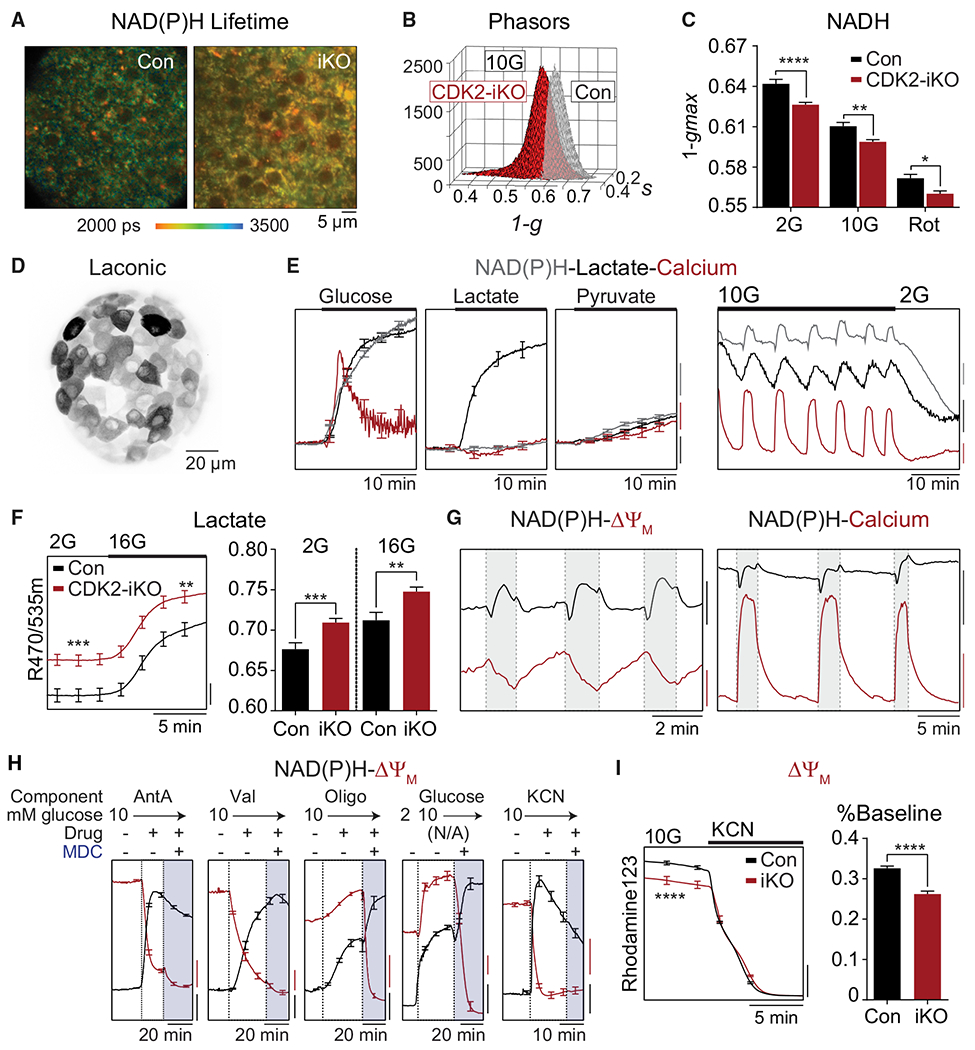
Figure 6. Enhanced metabolism in CDK2-iKO islets.

(A) Representative NAD(P)H fluorescence lifetime images from Con and CDK2-iKO islets imaged in 10G. Scale bar, 5 μM.
(B) Phasor histograms showing the frequency distribution of NAD(P)H lifetimes (1-g, s) in islets isolated from Con (n = 4) and CDK2-iKO (n = 4) mice imaged in 10G.
(C) Projection of the phasor histogram peak along the 1-g axis was used to quantify NAD(P)H utilization in the presence of 2G, 10G, and complex I inhibitor (5 μM rotenone [Rot], 15 min) as indicated (n = 10 islets per mouse for each condition).
(D) Maximum intensity projection of intact islet expressing Ad-RIP-Laconic in β cells imaged using a 2-photon Nikon TE-300 inverted confocal microscope.
(E) Left: response of each metabolite to 10G (n = 10 islets), 20 mM lactate (n = 12 islets), or 20 mM pyruvate (n = 10 islets) in islets isolated from 1 WT/B6J mouse, normalized to baseline signal at 2G. Scale bars, 2% baseline. Right: representative traces demonstrating the phase relationship between oscillations in NAD(P)H (endogenous, blue trace; scale bar, 200 IU), cytosolic lactate (Ad-RIP-Laconic, black trace; scale bar, 0.02 R470/535 m), and cytosolic calcium (FuraRed, red trace; scale bar, 0.05R 430/500×) at 10G and 2G.
(F) Increased lactate levels in CDK2-iKO islets (n = 59 islets from 3 mice) relative to Con (n = 72 islets from 4 mice) at 2G and 10G. Scale bar, 0.01 R470/535 m.
(G) Phase relationships between oscillations in NAD(P)H and ΔΨm (left) and cytosolic calcium (right). NAD(P)H: black scale bar, 100 IU (left) or 500 IU (right). ΔΨm: red scale bar, 50 IU. FuraRed (Ca2+): red scale bar, 0.2 R430/500×.
(H) Response of ΔΨm (red traces) and NAD(P)H (black traces) to the ETC inhibitors antimycin A(AntA; 1 μM, n = 10 islets), valinomycin (Val; 1 μM, n = 11 islets), and oligomycin (Oligo; 2 μM, n = 12 islets); to 10G (n = 11 islets); and to 5 mM cyanide (n = 11 islets) in islets isolated from 1 WT/B6J mouse. ΔΨm is normalized to fluorescence after depolarization with MDC. NAD(P)H is normalized to fluorescence at the beginning of the recording. Scale bars, 0.1 normalized IU.
(I) ΔΨm is depolarized in CDK2-iKO islets (n = 70 islets from 3 mice) relative to Con islets (n = 85 islets from 4 mice), normalized to fluorescence after depolarization with cyanide, quantified as percentage of baseline. Scale bar, 0.2 normalized IU.
Data are shown as mean ± SEM. *p < 0.05, **p < 0.01, ***p < 0.001, ****p < 0.0001 by one-way AVOVA (C) or t test (F and I).
