
Fig. 4.
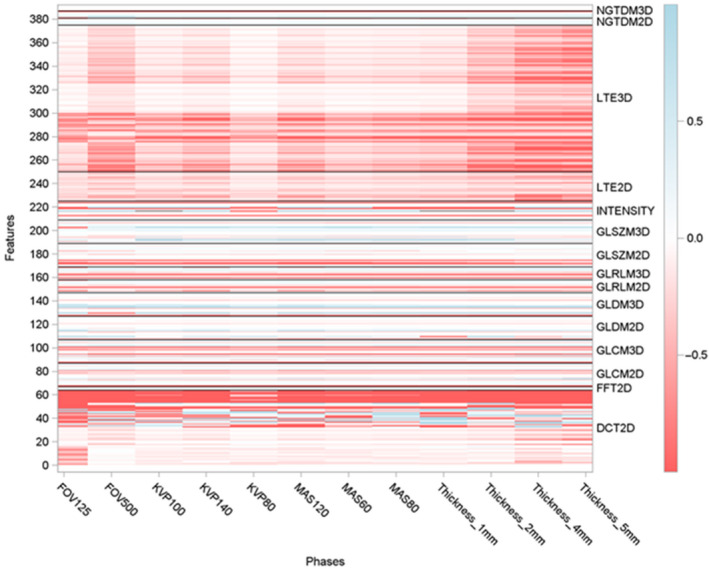
Heat map showing the beta (slope) value of each of the radiomic metrics across the four computed tomography scanners was obtained. Results of the study are presented as a heat map with values ranging from 1 (red) to 1 (blue), that is, negative linear correlation to positive linear correlation. The texture panel comprised of 387 features belonging to 15 subgroups of texture extraction methods (e.g., GLCM), shown on the y‐axis. Twelve unique image settings were tested on all the four scanners (e.g., FOV125), shown on the x axis.