
Fig. 5.
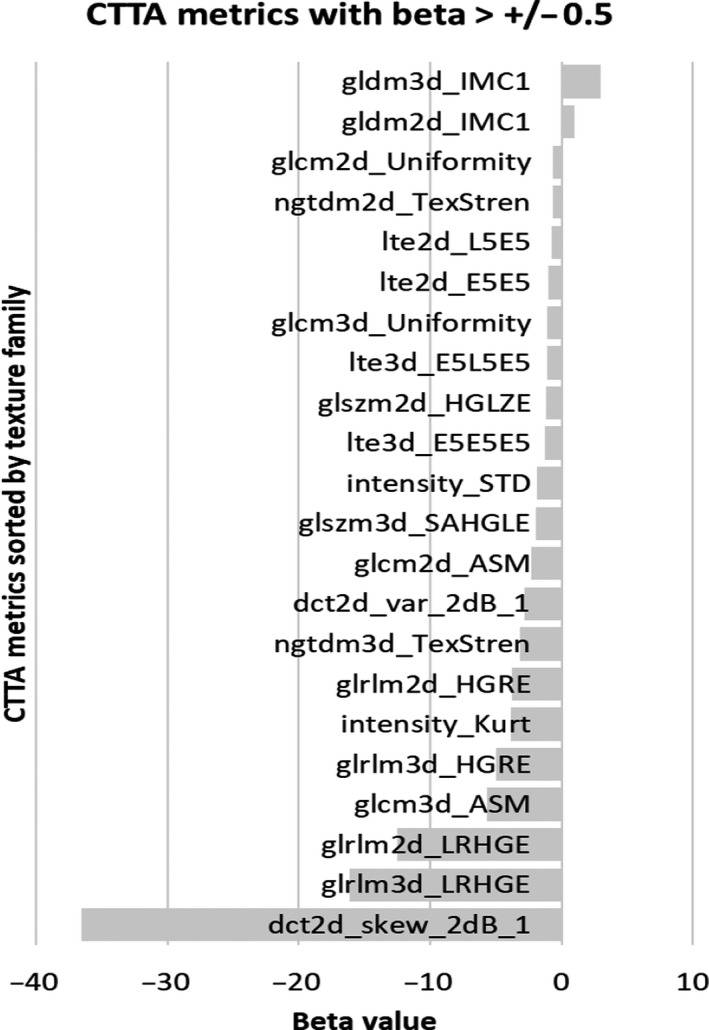
Bar plot showing the beta (slope) values of the radiomic metrics showing a beta value of >0.5 in the positive or negative direction, across the four computed tomography scanners and scanning settings. In case of multiple metrics per family, the top two (highest beta) were included in the plot.