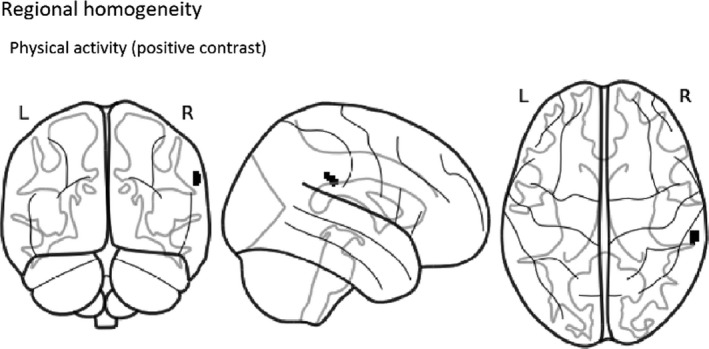
Figure 1.

Group‐level thresholded map of positive contrast (correlation) between moderate‐to‐vigorous physical activity and ReHo (p < .05, corrected for TFCE and family‐wise error). The colored area represents the region significantly correlated with physical activity
