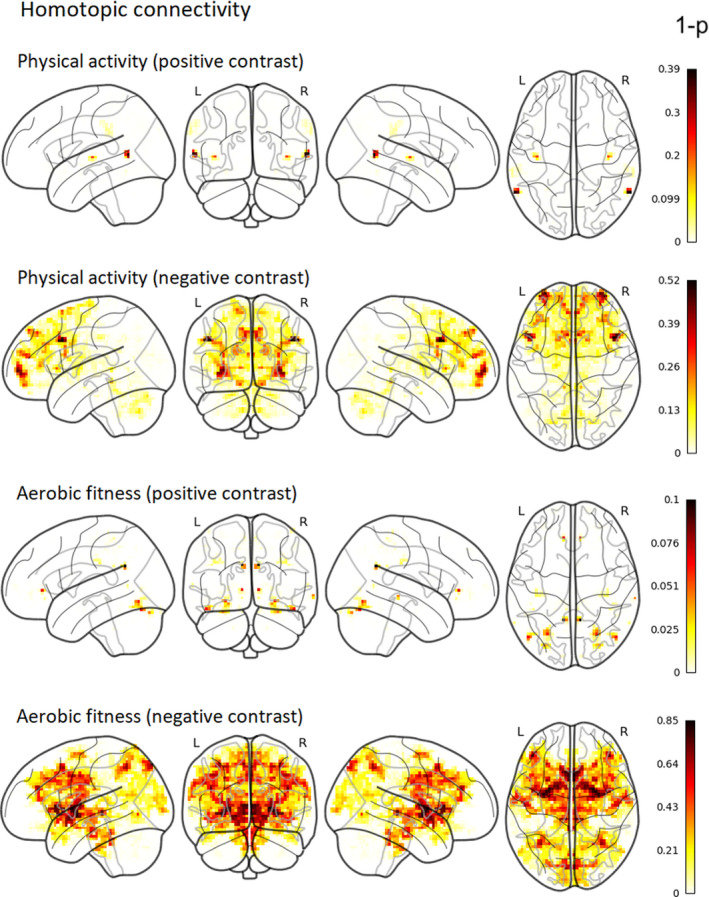
Figure 3.

Group‐level nonthresholded 1‐p‐value maps for the nonsignificant associations of physical activity and aerobic fitness with VMHC (corrected for TFCE and family‐wise error). Intensity of color represents 1‐p‐value (both significant and nonsignificant associations are shown). Thus, the darker color (red) represents a smaller p‐value, whereas the lighter color (yellow) represents a larger p‐value
