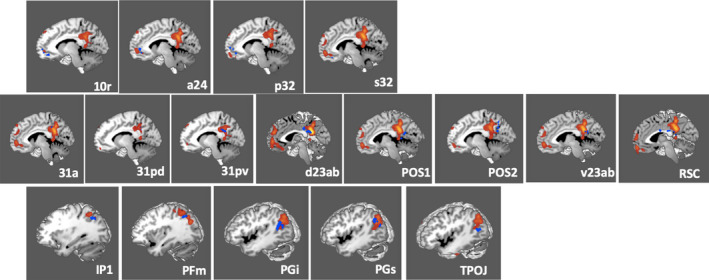
FIGURE 2.

Comparison overlays between the cortical parcellation data (blue) and activation likelihood estimation (ALE) data (red) from Figure 1 in the left cerebral hemisphere. Regions were visually assessed for inclusion in the network if they overlapped with the ALE data. Parcellations included in the DMN model were identified in the anterior cingulate area including 10r, a24, p32, and s32 (top row); posterior cingulate area including 31a, 31pd, 31pv, d23ab, POS1, POS2, v23ab, and RSC (middle row); and lateral parietal area including IP1, PFm, PGi, PGs, and TPOJ3 (bottom row). The labels indicate the parcellation shown in each panel
