FIGURE 4.

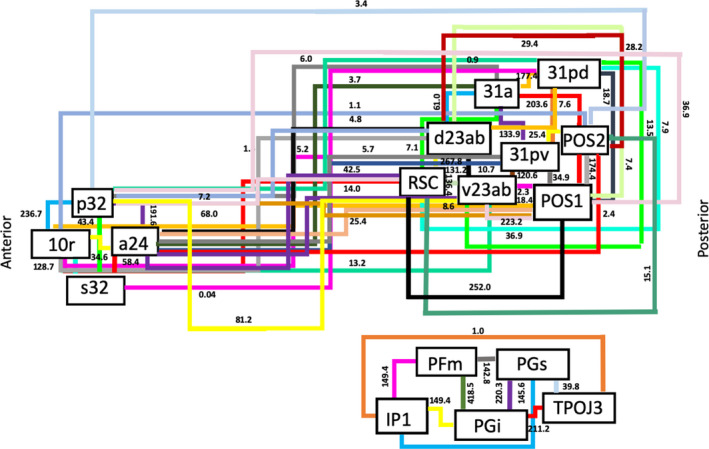
Simplified schematic of the white matter connections identified between individual parcellations of the default mode network during fiber tracking analysis. Connections are labeled with the average strength measured across all 25 subjects

Simplified schematic of the white matter connections identified between individual parcellations of the default mode network during fiber tracking analysis. Connections are labeled with the average strength measured across all 25 subjects