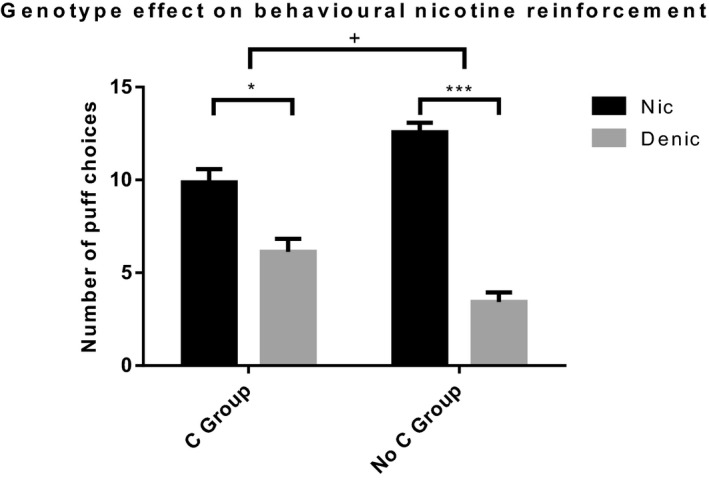
FIGURE 2.

Number of puff choices from Nic and Denic cigarettes across both genotype groups. There was a cigarette × genotype interaction (F (1,100) = 9.919, p = .002, = 0.090). In both genotype groups, there were significantly more Nic puffs than Denic puffs. However, this effect was smaller in the C group compared to the No C group. Denic, Denicotinized; Nic, Nicotinized. + = significant 2‐way interaction. * = p < .05. *** = p < .001
