
FIGURE 2.
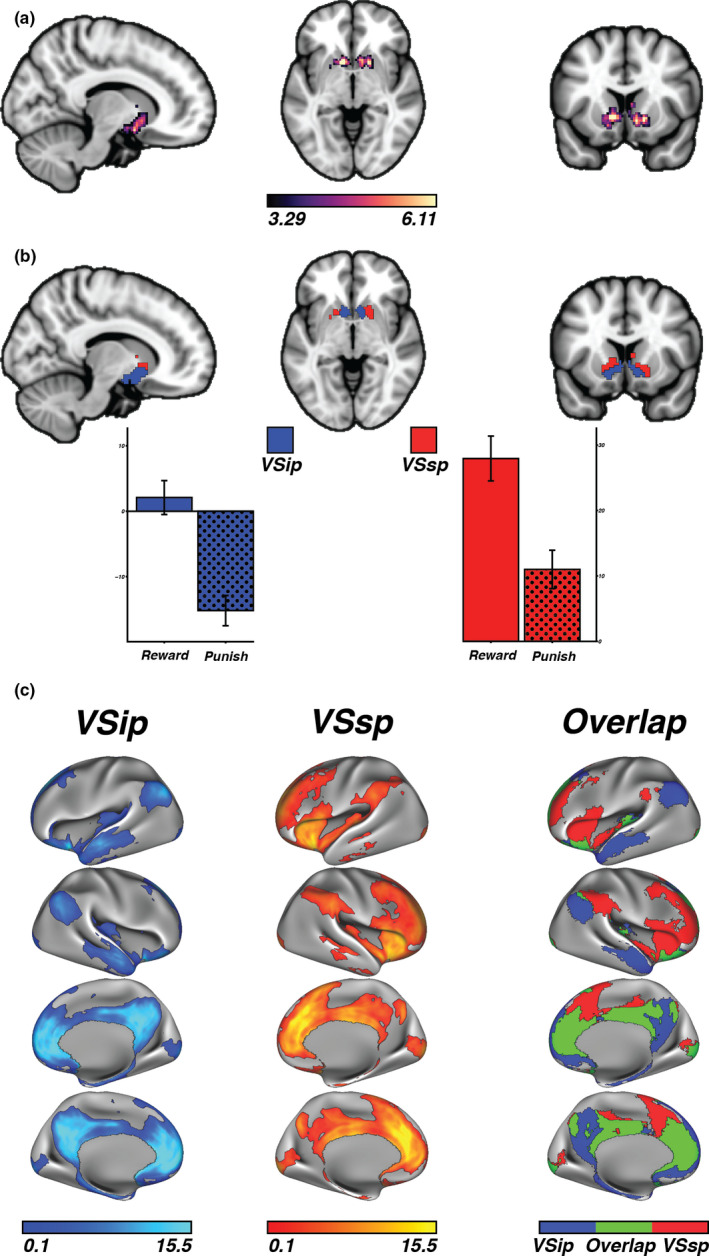
(a) The initial reward > punish cluster in the ventral striatum. Legend represents t statistics. (b) The two parcels, VSip and VSsp given by the k‐means clustering algorithm. Extracting the parameter estimates from reward and punish, respectively, showed that the VSip reward > punish difference was driven by less negative BOLD response to reward while the VSsp was driven by differences in positive BOLD responses to both conditions. (c) Functional connectivity profiles of the parcels. The VSip was predominantly connected to the default mode network, while the VSsp showed a split connection to the ventral attention and frontal control network. Spatial overlap between the parcel's functional connectivity profiles (threshold p < .05, respectively) was predominantly observed in the medial prefrontal cortex and posterior cingulate cortex