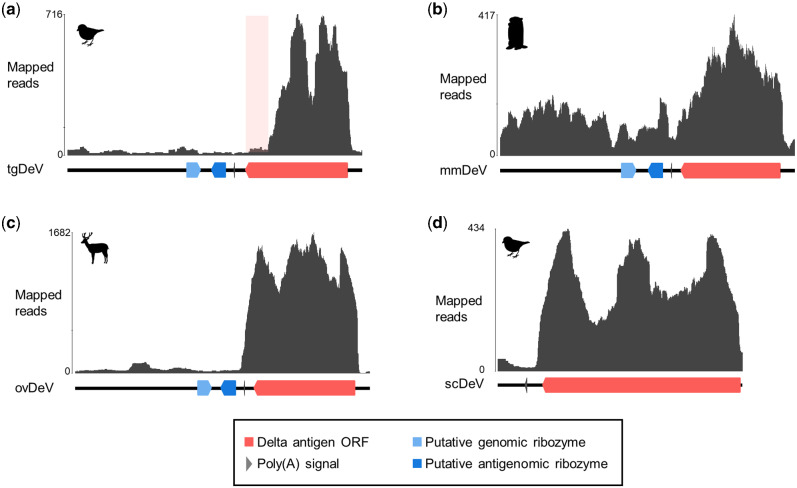
Figure 3.
Mapping coverages of original short reads of each contig. Mapped read graphs of (a) tgDeV, (b) mmDeV, and (c) ovDeV. Lines, arrow pentagons, and arrowheads indicate viral genomes, ribozymes, and poly(A) signals, respectively. The numbers above the graphs show nucleotide positions. The light pink box indicates a low read depth region in the putative transcript of tgDeV.

