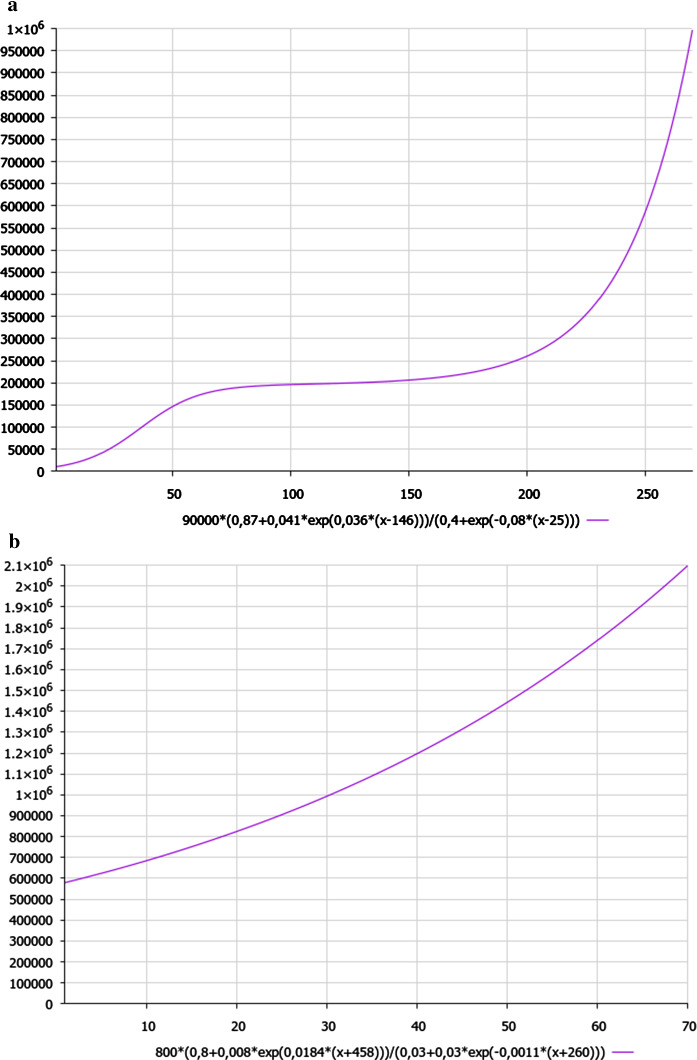
Fig. 3.
a A schematic dynamics of coronavirus cases in Germany for the first wave of pandemic. The start is 1 March 2020 (here we designate x = t, in days). b A schematic dynamics of coronavirus cases in Germany for second wave of pandemic. The start is 1 November 2020 (here we designate x = t, in days)

