
Figure 1.
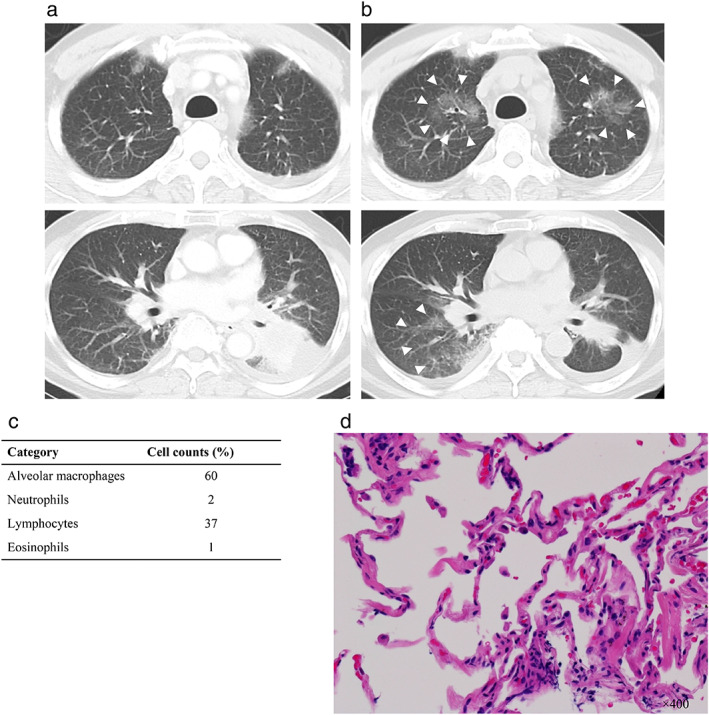
Computed tomography (CT) scan and histological findings indicative of capmatinib‐induced ILD. (a) CT scan showing the primary lung lesion in the left lower lobe before capmatinib treatment. (b) CT scan at 31 days after the initiation of capmatinib treatment showing extensive right consolidation with multiple ground‐glass opacities (GGOs) throughout both lungs (arrowheads), despite shrinkage of the primary lung lesion. (c) Cellular analysis of bronchoalveolar lavage fluid at 33 days after capmatinib initiation. (d) Hematoxylin‐eosin staining of a specimen of the right lung revealed mild infiltration of small round inflammatory cells and neutrophils at 33 days after capmatinib initiation.