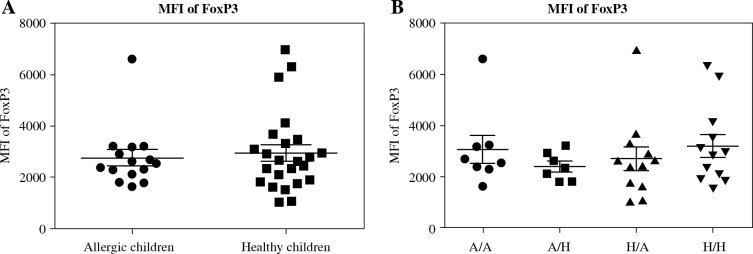
Fig. 3.
Median of fluorescence intensity in regulatory T cells (Tregs) in cord blood. Cord blood samples were stained and analysed by flow cytometry. A) Median of fluorescence intensity (MFI) of FoxP3 comparison in cord blood of allergic children (n = 15) and healthy children (n = 24); B) MFI of FoxP3 comparison in cord blood of allergic children of allergic mothers (A/A, n = 8), allergic children of healthy mothers (A/H, n = 7), healthy children of allergic mothers (H/A, n = 12) and healthy children of healthy mothers (H/H, n = 12)

