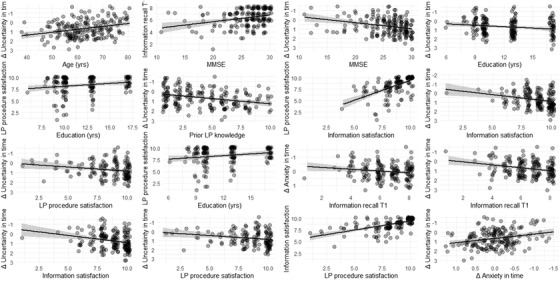
FIGURE 4.

Scatterplots present the association between outcome measures, and outcome measures and patient‐related factors. Of note, a positive Δ uncertainty or Δ anxiety over time (eg, +1) equals a decrease in uncertainty or anxiety over time, and vice versa
