Figure 1.
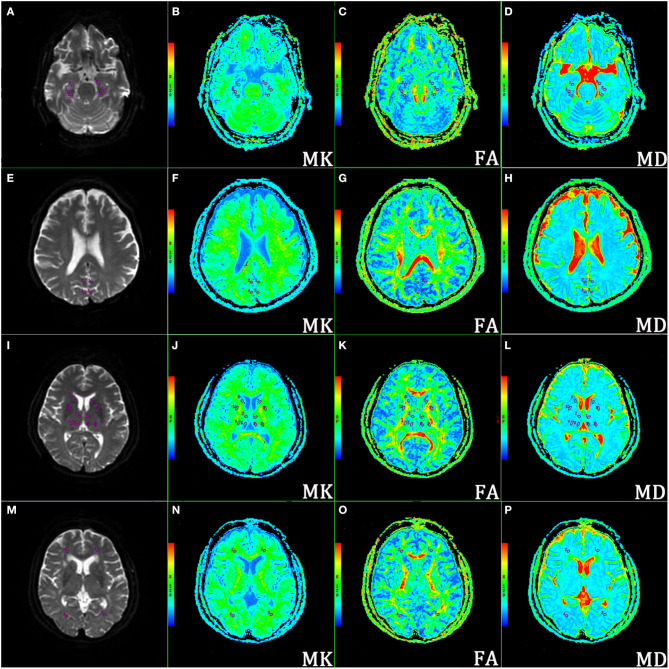
Representative locations of the regions of interest (ROIs) on corresponding axial b0 images and mean kurtosis (MK), fractional anisotropy (FA), and mean diffusivity (MD) maps. (A–D) ROIs of the bilateral hippocampal (Hip) subregions (head, body, and tail); (E–H) ROIs of bilateral posterior cingulate cortex (PCC) and precuneus (Pr); (I–L) ROIs of bilateral dorsal thalamus (DT) subregions (anterior nucleus, ventrolateral nucleus, and medial nucleus), lenticular nucleus (LN), and caput nuclei caudati (CNC); (M–P) ROIs of bilateral white matter of the occipital lobe (OLWM) and white matter of the frontal lobe (FLWM).

