FIGURE 1.
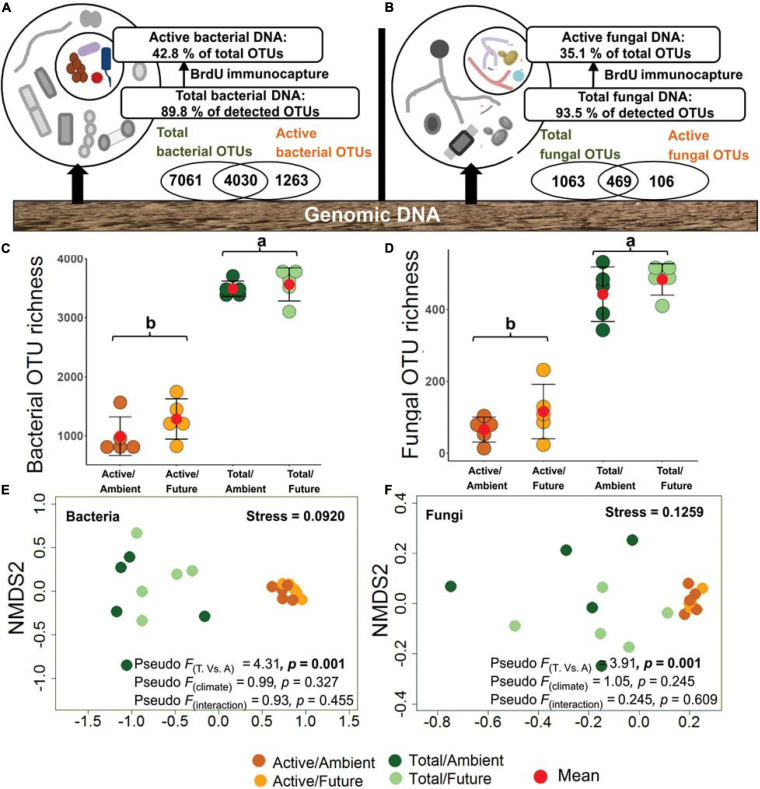
Richness and community composition of active (bromodeoxyuridine-labeled immunocaptured DNA) and total microbial communities. (A) 42.8% of bacterial and (B) 34.1% of fungal OTUs were representing the active community in the rhizosphere soil. (C) Total bacterial OTU richness (3,525 ± 63 OTUs, mean ± SE) was significantly higher (p < 0.001) than that of the active community (1,140 ± 110 OTUs). (D) OTU richness of total fungal community (463 ± 20 OTUs) was significantly higher (p < 0.001) as compared with the active community (91 ± 20 OTUs). Values with the same letter did not differ significantly according to Tukey’s HSD tests. Nonmetric multidimensional scaling (NMDS) ordination plots of active and total (E) bacterial and (F) fungal community composition under ambient and climate regimes; the plots indicate Jaccard dissimilarity between samples based on presence/absence data; the plots are supported by the results of two-way NPMANOVA. T, total community; A, active community.

