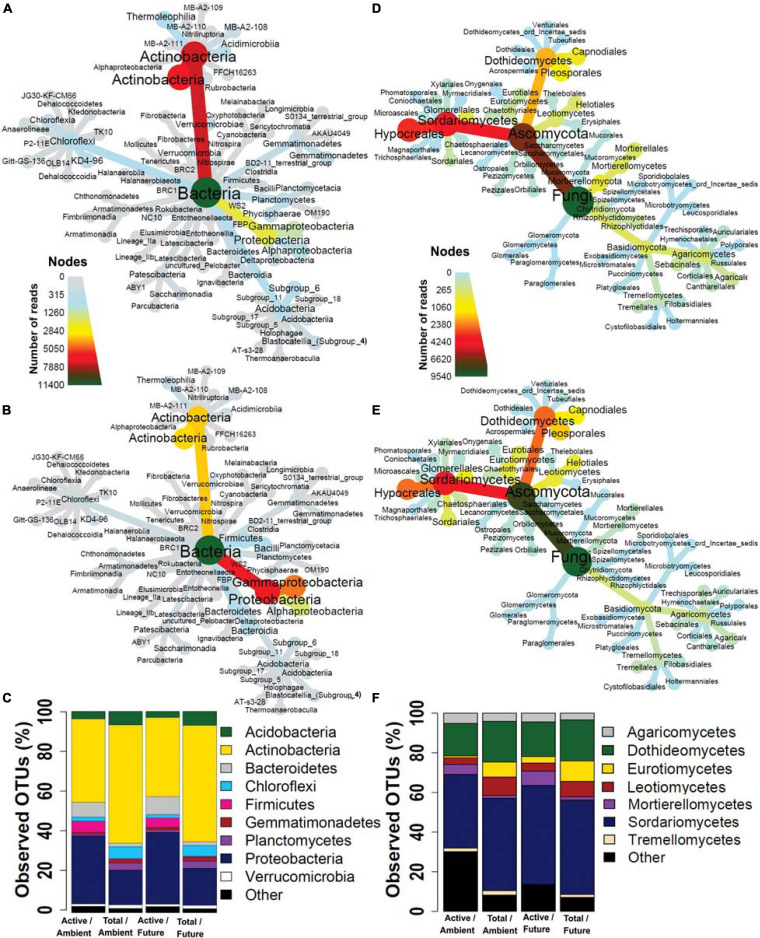
FIGURE 2.
Taxonomic composition of (A) total and (B) active bacteria and (D) total and (E) active fungi represented by heat trees. Each node of the heat tree represents a taxon used to classify OTUs, and the edges determine where it fits in the overall taxonomic hierarchy. The color scale of the nodes and edges represents the sequences reads abundance. Microbial community structures at (C) phylum level in bacteria and (F) class level in fungi. The bar plot shows the OTU richness of the active and total microbial community under the ambient and future climate regimes.

