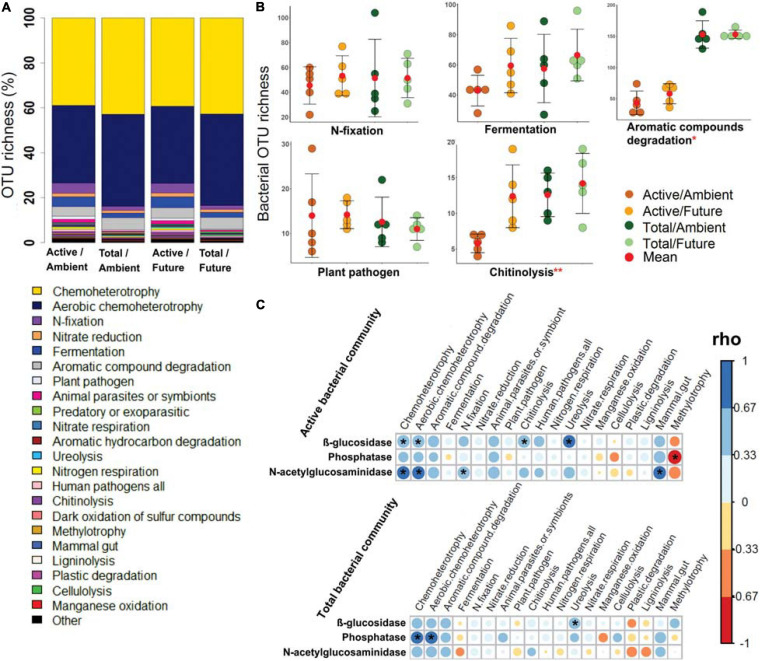
FIGURE 3.
The potential bacterial functions based on FAPROTAX database. (A) Bar plot shows a comparison of predicted functions between active and total bacterial communities under ambient and future climate regimes based on the percentage of observed OTUs in each treatment. (B) OTU richness of five of highly abundant functions. *Significant difference of functional richness between metabolically active and total community (p < 0.05, two-way ANOVA test). **Significant difference of functional richness between metabolically active and total community and a significant influence of climate regime on the functional richness (p < 0.05, two-way ANOVA test). (C) Spearman’s rank correlation (rho) between the OTU richness of detected functions (in active and total community composition) and the measured enzyme activities in the rhizosphere soil. *Significant correlations (p < 0.05) between the two factors are indicated by asterisks.

