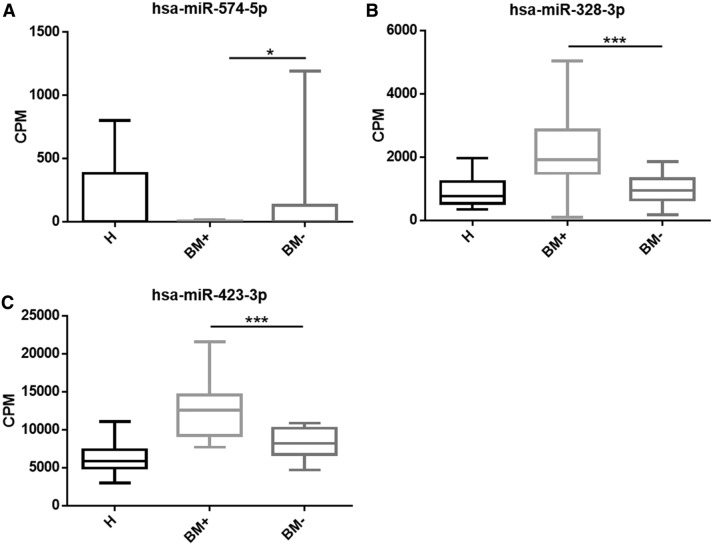
Fig. 3.
hsa-miR-574-5p, hsa-miR-328-3p and hsa-miR-423-3p were significantly up-regulated in BM+ groups. Box plot showing the individual CPM of hsa-miR-574-5p (a), hsa-miR-328-3p (b), hsa-miR-423-3p (c) in each sample group. P value was calculated using t-test. H: Healthy population; BM+ : samples from patients with bone-metastasis; BM−: samples from patients without bone-metastasis. Each column represented one group and the error bar indicated the S.E.M.*p < 0.05; ***p < 0.0001

