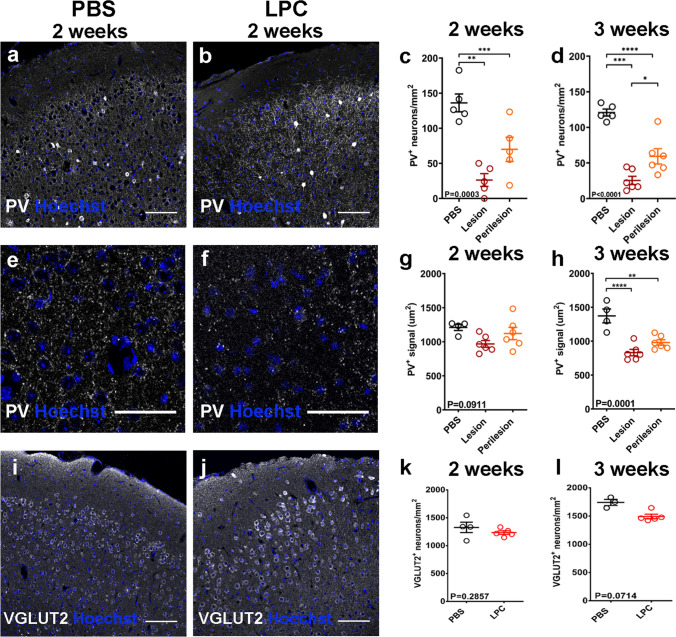
Fig. 3.
a and b Immunohistochemistry of PBS (a) and LPC (b) treated animals for PV (white) with Hoechst (blue) two weeks post-surgery. Scale bar: 100 μm. c–d Quantification of PV + neurons in L2/3 of PBS and LPC-treated animals two weeks (c, PBS: mean 136.1 ± 12.71 SEM neurons/mm2, N = 5, Lesion: mean 12.71 ± 9.107 SEM neurons/mm2, Perilesion: mean 69.96 ± 17.23 SEM neurons/mm2, N = 5; each point is an animal, One-way ANOVA) and three weeks post-surgery (d, PBS: mean 120.8 ± 4.876 SEM neurons/mm2, N = 5, Lesion: mean 25.46 ± 5.756 SEM neurons/mm2, Perilesion: mean 59.35 ± 10.80 SEM neurons/mm2, N = 6; each point is an animal, One-way ANOVA). e–f Immunohistochemistry of PBS (e) and LPC (f) treated animals for PV (white) with Hoechst (blue) focusing on PV + puncta at L2/3, two weeks post-surgery. Scale bar: 50 μm. g-h Quantification of PV + area in L2/3 of PBS and LPC-treated animals two weeks (g, PBS: mean 1211 ± 45.12 SEM μm2, N = 3, Lesion: mean 831.7 ± 47.26 SEM μm2, Perilesion: 981.0 ± 40.64 SEM μm2, N = 6; each point is an animal, One-way ANOVA) and three weeks post-surgery (h, PBS: mean 1373 ± 102.4 SEM μm2, N = 4, Lesion: mean 968.1 ± 50.00SEM μm2, Perilesion: mean 1121 ± 90.13 SEM μm2, N = 6, each point is an animal, One-way ANOVA). i-j Immunohistochemistry of PBS (i) and LPC (j) treated animals for VGLUT2 (white) with Hoechst (blue) two weeks post-surgery. Scale bar: 100 μm. k-l Quantification of VGLUT2 + neurons in L2/3 of PBS and LPC-treated animals two weeks (k, PBS: mean 1328 ± 93.33 SEM neurons/mm2, N = 4, LPC: mean 1234 ± 31.72 SEM neurons/mm2, N = 5; each point is an animal, Mann Whitney test) and three weeks post-surgery (l, PBS: mean 1741 ± 54.65 SEM neurons/mm2, N = 3, LPC: mean 1492 ± 39.51 SEM neurons/mm2, N = 5; each point is an animal, Mann Whitney test)

