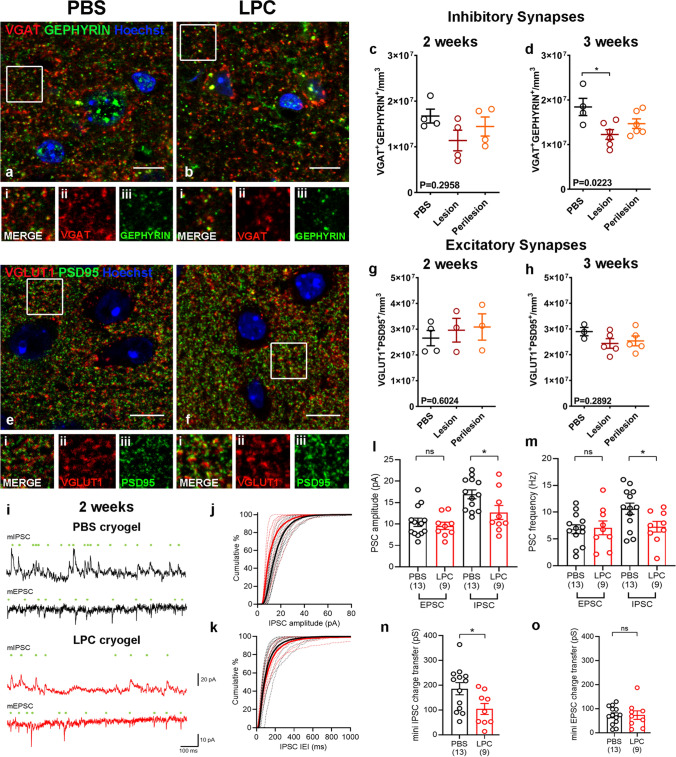
Fig. 4.
a and b Immunohistochemistry of PBS (a) and LPC (b) treated animals for VGAT (red), GEPHYRIN (green) with Hoechst (blue) two weeks post-surgery. i–iii: Inset images of boxed areas in a or b showing merged (i) and single channels of the synaptic proteins VGAT (ii) and GEPHYRIN (iii). Scale bar: 10 μm. c-d Quantification of VGAT1 + /GEPHYRIN + inhibitory synapses in L2/3 of PBS and LPC-treated animals two (c, PBS: mean 1.673e + 007 ± 1.520e + 006 SEM synapses/mm3, N = 4, Lesion: mean 1.138e + 007 ± 2.255e + 006 SEM synapses/mm3, Perilesion: mean 1.444e + 007 ± 2.092e + 006 SEM synapses/mm3, N = 4; each point is an animal, Kruskal–Wallis test) and three weeks post-surgery (d, PBS: mean 1.844e + 007 ± 1.936e + 006 SEM synapses/mm3, N = 4, Lesion: mean 1.226e + 007 ± 1.088e + 006 SEM synapses/mm3, Perilesion: mean 1.469e + 007 ± 1.072e + 006 SEM synapses/mm3, N = 6; each point is an animal, One-way ANOVA). e–f Immunohistochemistry of PBS (e) and LPC (f) treated animals for VGLUT1 (red), PSD95 (green) with Hoechst (blue) two weeks post-surgery. i–iii: Inset images of boxed areas in e or f showing merged (i) and single channels of the synaptic proteins VGLUT1 (ii) and PSD95 (iii). Scale bar: 10 μm. g-h Quantification of VGLUT1 + /PSD95 + excitatory synapses in L2/3 of PBS and LPC-treated animals two weeks (g, PBS: mean 2.653e + 007 ± 2.963e + 006 SEM synapses/mm3, N = 4, Lesion: mean 2.961e + 007 ± 4.605e + 006 SEM synapses/mm3, Perilesion: mean 3.086e + 007 ± 5.115e + 006 SEM synapses/mm3, N = 3; each point is an animal, Kruskal–Wallis test) and three weeks post-surgery (h, PBS: mean 2.899e + 007 ± 1.597e + 006 SEM synapses/mm3, N = 3, Lesion: mean 2.438e + 007 ± 1.875e + 006 SEM synapses/mm3, Perilesion: mean 2.4536e + 007 ± 1.908e + 006 SEM synapses/mm3, N = 5; each point is an animal, Kruskal–Wallis test). i: Representative miniature inhibitory postsynaptic currents (mIPSC) and miniature excitatory postsynaptic currents (mEPSC) recorded at 0 mV and -70 mV respectively in the presence of 500 nM TTX, from L2 pyramidal cells from the motor cortex, 2 weeks post-surgery. Individual detected miniature events are indicated (green dots). Data are shown from representative cells from PBS (upper, black) and LPC (lower, red) treated mice. j: Cumulative distribution of mIPSC amplitudes from PBS (black) and LPC (red) treated mice, recorded at 2 weeks following surgery. Individual distributions from each neuron (thin dashed lines) are shown underlying the mean distribution (thick lines). k: Cumulative distributions of IPSC inter-event interval (IEI) recorded at 2 weeks post-surgery, plotted according to the same scheme as j. l: Amplitudes of mEPSC and mIPSCs recorded from L2 pyramidal neurons in PBS (black) and LPC (red) treated mice at 2 weeks post-surgery (5 PBS mice and 3 LPC mice). Number of recorded neurons is indicated. m: Frequencies of mEPSC and mIPSCs recorded from l2 pyramidal neurons in PBS (black) and LPC (red) treated mice at 2 weeks post-surgery (5 PBS mice and 3 LPC mice). Number of recorded neurons is indicated. n: Total charge transferred by mIPSCs recorded at 0 mV for 5 min at 2 weeks post-surgery (5 PBS mice and 3 LPC mice). Number of recorded neurons is indicated. o: Total charge transferred by mEPSCs recorded at -70 mV over 5 min of recording from PBS and LPC treated mice at 2 weeks post-surgery (5 PBS mice and 3 LPC mice). Number of recorded neurons is indicated. Statistics shown non-significance (ns) – p > .05, *—p < .05, unpaired t-tests with Welch’s correction

