Fig. 2.
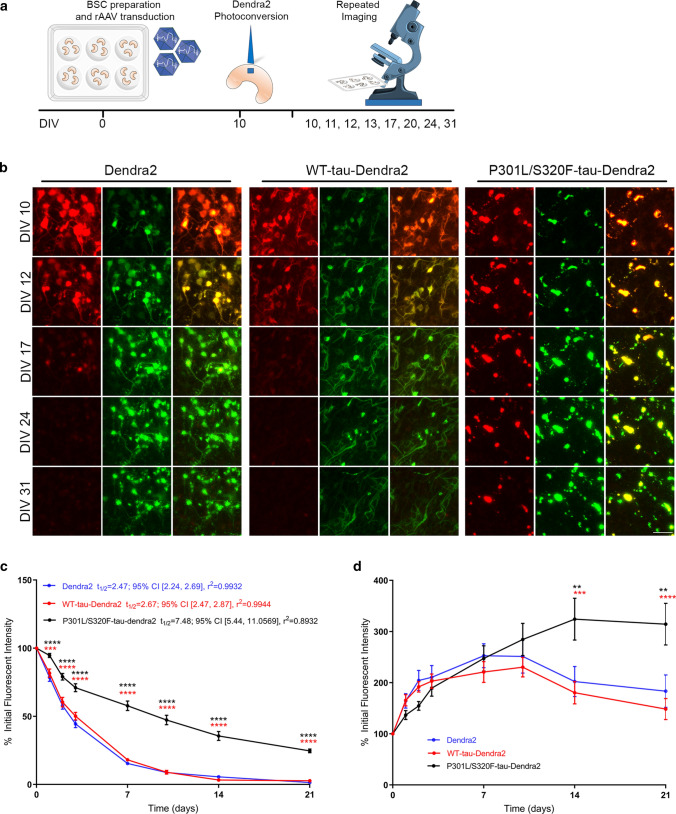
P301L/S320F-tau-Dendra2 is long-lived compared to WT-tau-Dendra2 but is produced at a similar rate in BSCs. a A schematic diagram shows the timeline of the long-term optical pulse labeling experiments using photoconversion of Dendra2, WT-tau-Dendra2 and P301L/S320F-tau-Dendra2 over 31 DIV. b Representative images of emitted fluorescence of photoconverted (red) and newly synthesized (green) Dendra2 in BSCs transduced at 0 DIV with Dendra2, WT-tau-Dendra2, or P301L/S320F-tau-Dendra2, photoconverted at 10 DIV and imaged at several time points from 10 DIV (immediately post-photoconversion) until 31 DIV (21 days post-photoconversion). Merge of both channels is also shown. Scale bar = 50 µm. c Line graphs show amounts of photoconverted Dendra2 fluorescent intensity in each condition that were quantified over time as a proportion of initial fluorescent intensity (n = 12, data are mean ± SEM, analyzed by Two-way ANOVA with post hoc Sidak’s test; ***p < 0.001, ****p < 0.0001, p values in black; Dendra2 v P301L/S320F-tau-Dendra2, p values in red; WT-tau-Dendra2 v P301L/S320F-tau-Dendra2). d Line graphs show amounts of green Dendra2 fluorescent intensity in each condition that were quantified over time as a proportion of initial fluorescent intensity (n = 12, data are mean ± SEM, analyzed by two-way ANOVA with post hoc Sidak’s test; **p < 0.01, ***p < 0.001, ****p < 0.0001, p values in black; Dendra2 v P301L/S320F-tau-Dendra2, p values in red; WT-tau-Dendra2 v P301L/S320F-tau-Dendra2)

