Fig. 4.
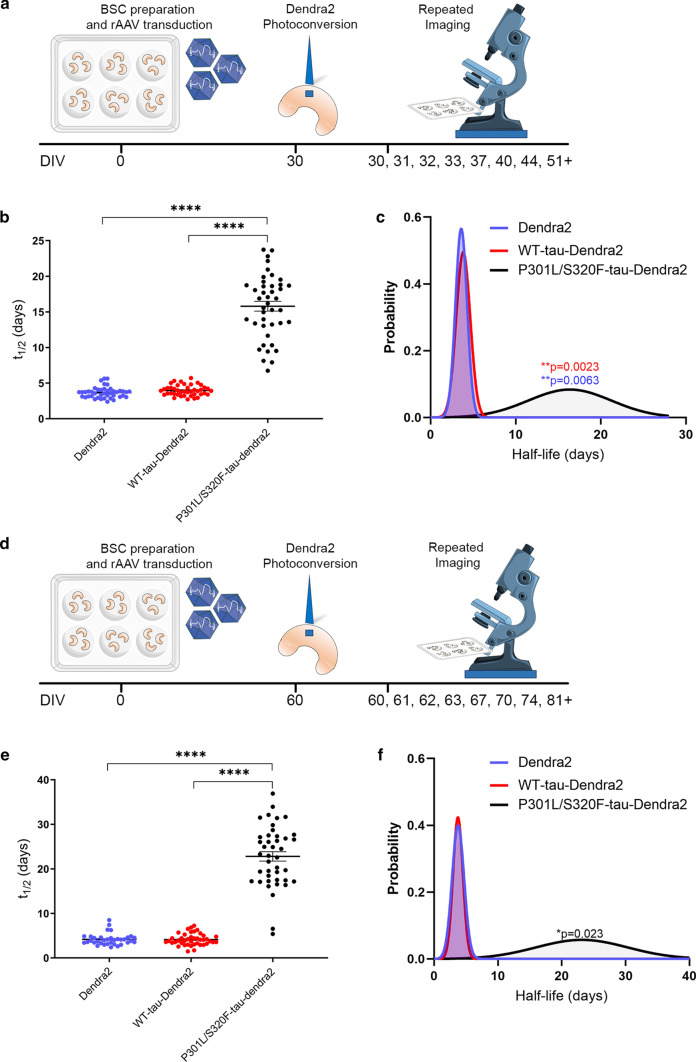
Tau inclusions continue to turnover after extended periods in culture but at a slower rate. a Schematic diagram shows the timeline of the long-term optical pulse labeling experiments using photoconversion of Dendra2, WT-tau-Dendra2 and P301L/S320F-tau-Dendra2 imaging photoconverting at a later time point in culture ~ 1 month old. b Scatter plot of half-life estimates for individual living cells in BSCs expressing Dendra2, WT-tau-Dendra2 or P301L/S320F-tau-Dendra2 (n = 42; ****p < 0.0001, one-way ANOVA). c Probability density plot of half-life estimates for individual living cells expressing Dendra2, WT-tau-Dendra2 or P301L/S320F-tau-Dendra2 (n = 42; **p = 0.0023, two-sided Kolmogorov–Smirnov test of P301L/S320F-tau-Dendra2 v WT-tau-Dendra2, **p = 0.0063, two-sided Kolmogorov–Smirnov test of P301L/S320F-tau-Dendra2 v Dendra2). Values were pooled from 6 BSCs per condition. d Schematic diagram shows the timeline of the long-term optical pulse labeling experiments using photoconversion of Dendra2, WT-tau-Dendra2 and P301L/S320F-tau-Dendra2 imaging photoconverting at a further extended time point in culture ~ 2 months old. e Scatter plot of half-life estimates for individual living cells in BSCs expressing Dendra2, WT-tau-Dendra2 or P301L/S320F-tau-Dendra2 (n = 42; ****p < 0.0001, one-way ANOVA). f Probability density plot of half-life estimates for individual living cells expressing Dendra2, WT-tau-Dendra2 or P301L/S320F-tau-Dendra2 (n = 35–42; *p = 0.023, two-sided Kolmogorov–Smirnov test of P301L/S320F-tau-Dendra2 v Dendra2/WT-tau-Dendra2). Values were pooled from 5–6 BSCs per condition

