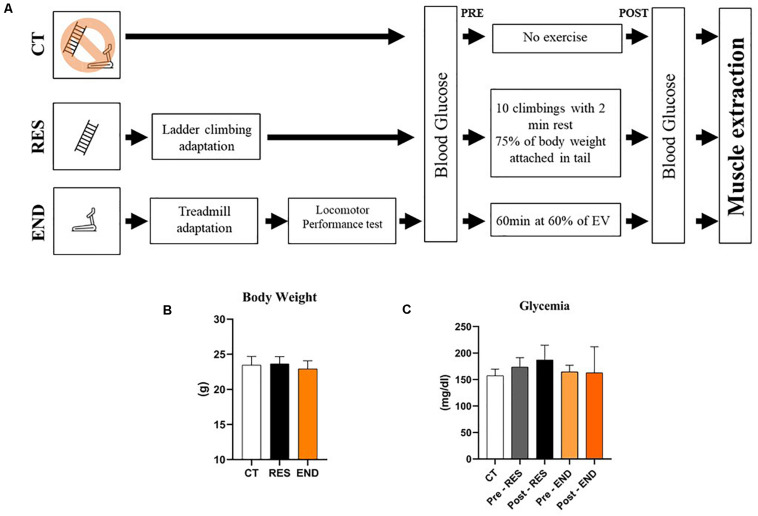
FIGURE 1.
Schematic representation of the experimental procedures (A); Body weight of the CT, RES, and END groups (B); Glycemia of the CT, RES, and END groups (C). Data correspond to the mean ± SD of n = 5 mice/group. CT, sedentary mice; RES, mice submitted to the resistance protocol; END, mice submitted to the endurance protocol.

