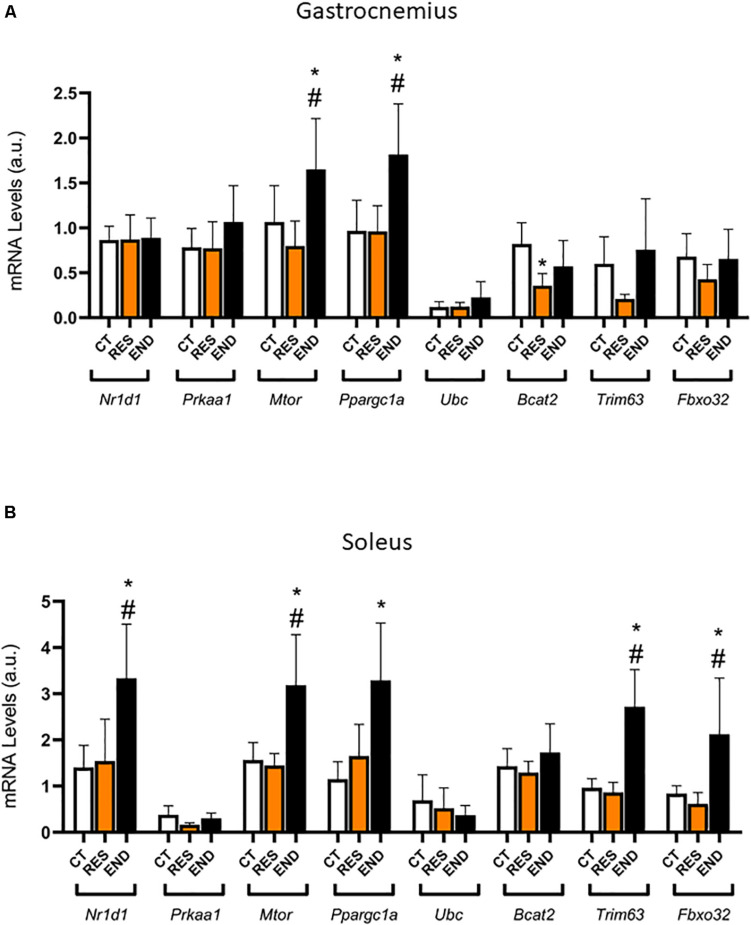
FIGURE 2.
(A) Gastrocnemius mRNA levels of Nr1d1, Prkaa1, Ppargc1a, Mtor, Fbxo32, Trim63, Ubc, and Bcat2. (B) Soleus mRNA levels of Nr1d1, Prkaa1, Ppargc1a, Mtor, Fbxo32, Trim63, Ubc, and Bcat2. Data correspond to the mean ± SD of n = 5 mice/group. *p ≤ 0.05 vs. END group; #p ≤ 0.05 vs. RES group. CT, sedentary mice; RES, mice submitted to the resistance protocol; END, mice submitted to the endurance protocol.

