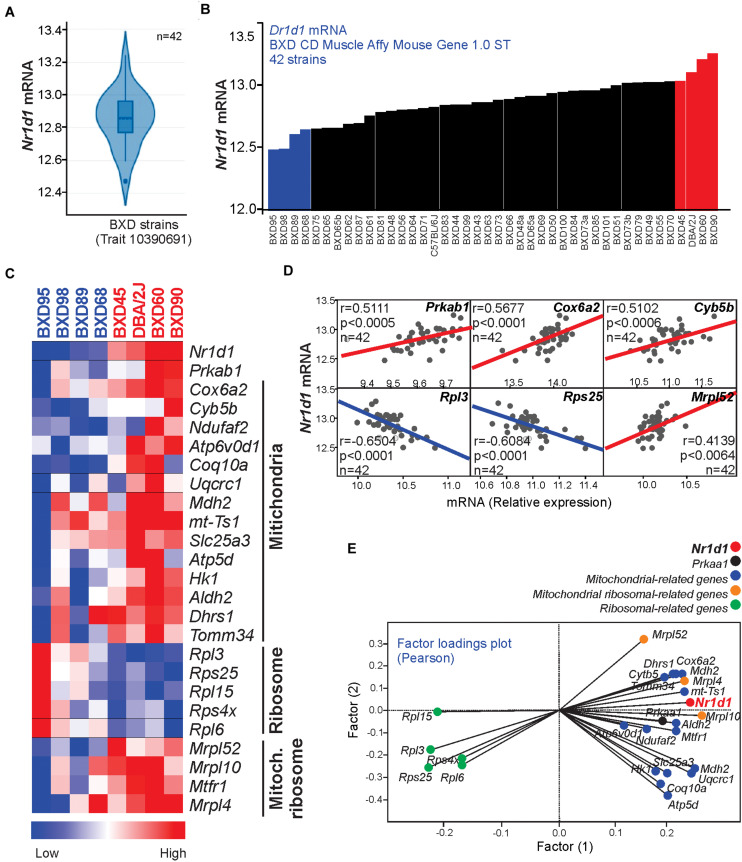
FIGURE 4.
(A) The violin plot shows the Nr1d1 gene expression distribution in the muscle of 42 BXD mice strains (B) Nr1d1 gene expression in each BXD strain muscle. (C) Heatmap graph highlighting the gene expression in 4 BXD strains with low (blue) and 4 BXD strains with high (red). (D) Pearson’s correlation and (E) two factors analysis graphs show the correlation between Nr1d1gene expression and Prkaa1 mRNA levels, mitochondrial-related, and ribosomal-related genes. Blue lines indicate negative and red lines indicate a positive correlation.

