Figure 1.
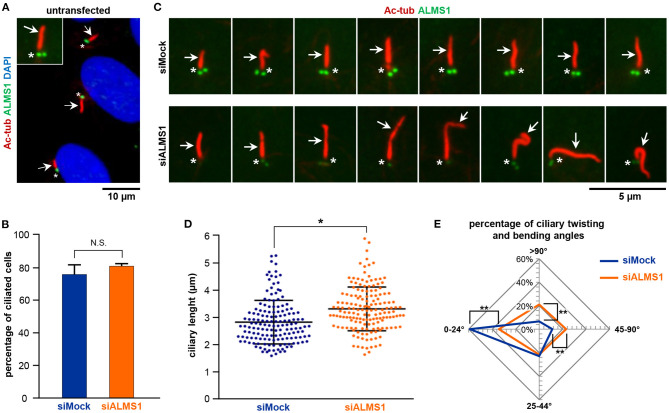
ALMS1 knockdown increases the number of aberrant cilia and ciliary length. (A) Representative immunofluorescence image of primary cilia in untransfected cells. Primary cilia (arrows) are stained in red, ALMS1 protein (asterisks) in green and cell nuclei in blue (DAPI). A zoomed cilium is also shown. (B) Percentage of ciliated cells in control (siMock) and silenced (siALMS1) cells (n = 3). (C) Representative immunofluorescence images of primary cilia in control and silenced cells showing different aberrant morphologies (n = 3). (D) Dot plot representing each of the measurements of ciliary length for control and silenced cells; n = 3 with at least 50 cilia measured per biological replicate. (E) Radar plot of the percentage of ciliary twisting and its bending angles between control and silenced cells (n = 3). Error bars represent mean ± SD (*p < 0.05, **p < 0.01).

