Figure 10.
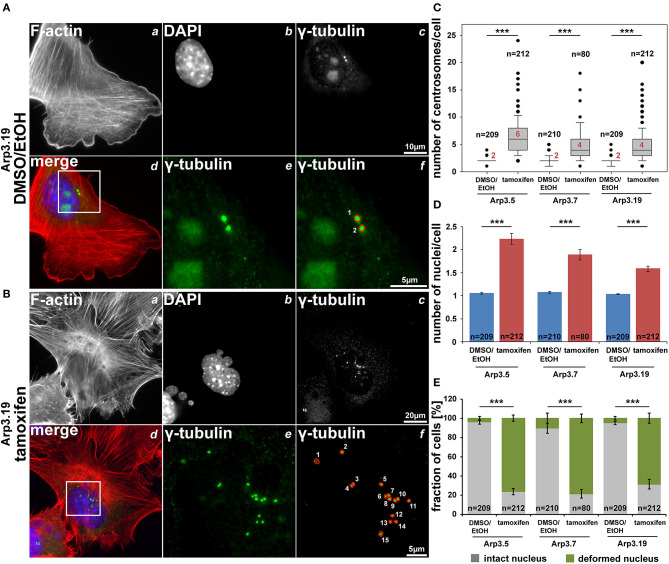
Arp3 depletion causes an increase of centrosome and nucleus numbers as well as nuclear deformation. (A,B) Representative fluorescence microscopy images of Actr3fl/fl cells (clone Arp3.19) stained for the F-actin cytoskeleton with phalloidin (a), nuclei using DAPI (b) and γ-tubulin for centrosomes (c). Merged images (d) display actin filaments in red, nuclei in blue and centrosomes in green. White rectangles in (d) mark regions of interest enlarged in (e) displaying centrosomes, the quantification of which is illustrated in (f). (C,D) Box and whiskers plots (as described for Figure 4B) displaying numbers of centrosomes (C) or of nuclei (D). For statistics, non-parametric, Mann-Whitney rank sum tests were used (***p < 0.001). (E) Analysis of nuclear morphologies. Cells were categorized according to the morphological integrity of their nuclei (intact nuclei in gray; deformed nuclei in green), represented as a fraction of all cells analyzed in individual cell populations. Results are depicted as stacked columns representing arithmetic means and SEMs from three independent experiments; non-parametric, Mann-Whitney rank sum test for statistics (***p < 0.001), n = total number of cells analyzed in (C–E).

