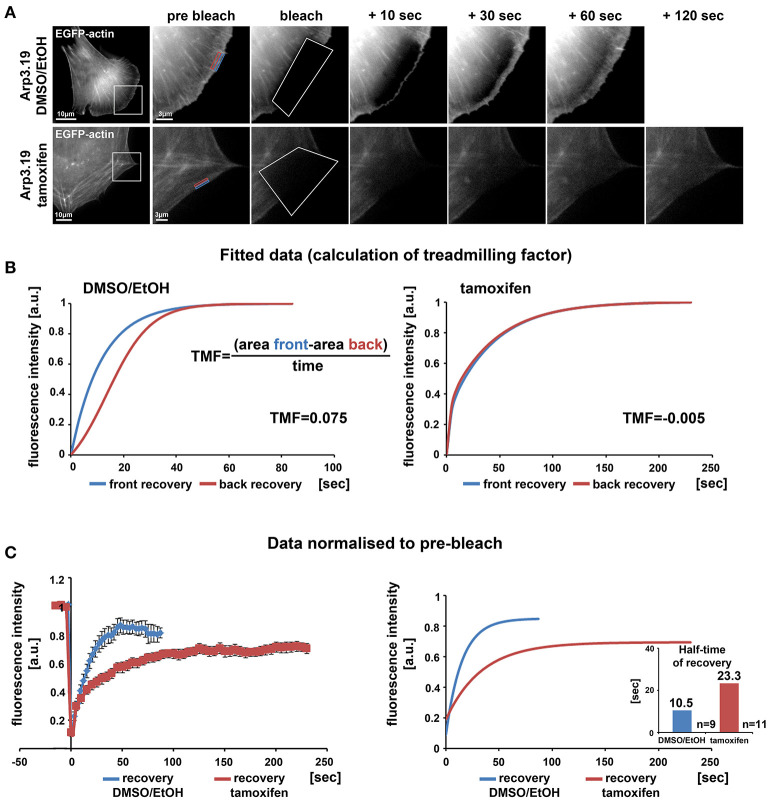
Figure 3.
Loss of the Arp2/3 complex interferes with treadmilling and F-actin turnover at the cell periphery. (A) Time-lapse images of representative FRAP experiments in Actr3fl/fl cells with or without tamoxifen treatment (clone Arp3.19) expressing EGFP-actin. Regions of interest (ROI) are marked with white rectangles in overview images on the left. Different time points of enlarged ROI on right-hand panels display fluorescence signals of EGFP-actin immediately pre and after bleach as well as at different time points of fluorescence recovery. White polygons highlight photobleached regions at the cell periphery. Changes in signal intensities over time for calculations of treadmilling factors (TMF) were quantified within a region of 0.5 μm at the front part (blue rectangle) as well as back part (red rectangle) of the lamellipodium in the Actr3fl/fl cell or the corresponding periphery of the cell following Arp3 depletion. (B) Average fitted recovery curves of front (blue) and back (red) regions of Arp3-expressing (left) and Arp3-depleted cells (right) used to calculate the TMF utilizing the illustrated equation. Data were collected from 9 control and 11 tamoxifen-treated cells acquired in three independent experimental days. The treadmilling factor is defined as average difference in fluorescence recovery in the distal vs. proximal half of the lamellipodium. Note that this difference is absent in tamoxifen-treated cells, demonstrating that presence of a functional Arp2/3 complex is essential for bona fide treadmilling at the cell periphery. (C) EGFP-actin FRAP recovery curves within a 1 μm deep peripheral region of DMSO/EtOH (blue) vs. tamoxifen-treated (red) Arp3.19 cells. Analysis was performed on the same time-lapse movies as used for the analysis in (B); data are arithmetic means and SEMs from movies the pre-bleach intensities of which were normalized to 1. Right panel shows fitted curves derived from raw data depicted on the left. Bar chart displays half times of fluorescent recovery as calculated from fitted curves. Note the marked decrease of F-actin turnover (increase of half-time of EGFP-actin fluorescence recovery) upon Arp3 depletion.

