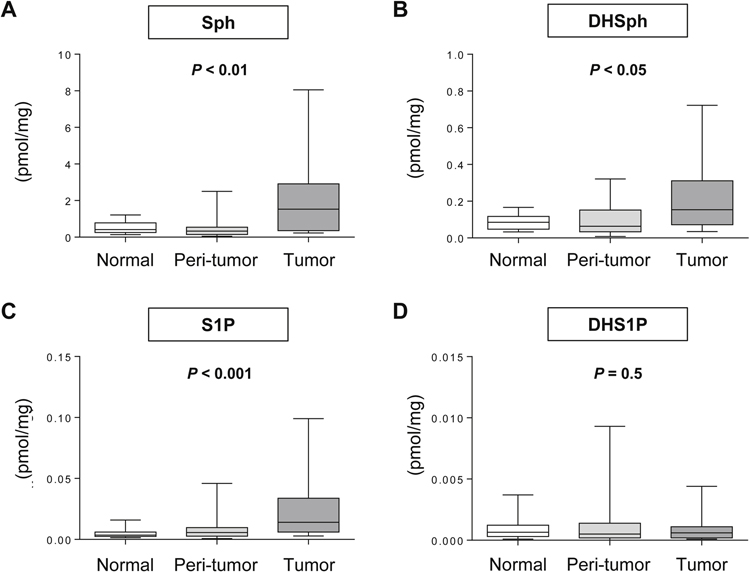
Fig. 1 – Levels of S1P and other sphingolipids in different locations of breast tissue.
The levels of Sph (A), DHSph (B), S1P (C) and DHS1P (D) were determined by LC-ESI-MS/MS in tumor, peri-tumor, and normal breast tissue from surgical specimens. Each box plot represents the minimum, mean, max and 25th and 75th percentiles of the indicated sphingolipid (mmol/mg).

