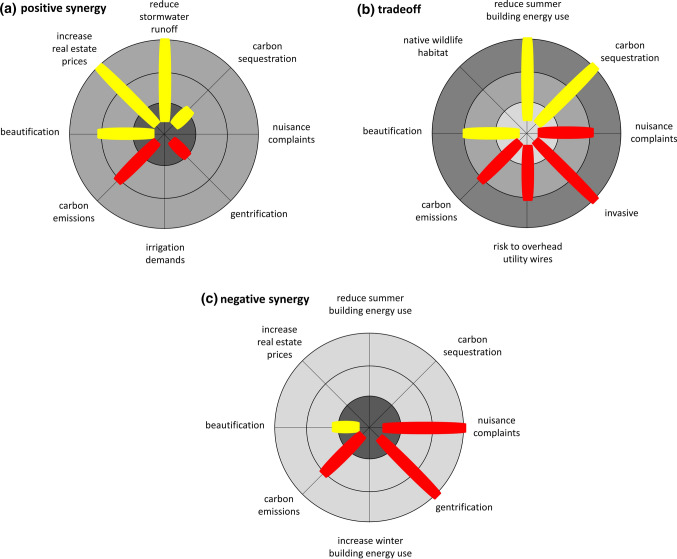
Fig. 4.
Flower diagrams depicting scenarios with multiple ecosystem services (yellow) and disservices (red) for urban trees. The length of each ‘petal’ reflects the relative magnitude of each service or disservice. Scenarios with far more services than disservices are positive synergies (a), while similar levels of services and disservices are tradeoffs (b), and far higher levels of disservices compared to services are negative synergies (c). The grey circles reflect management costs, with dark grey indicating higher costs. The inner-most circle represents installation costs, medium circle short-term maintenance, and large circle long-term maintenance. See Table 2 for more details

