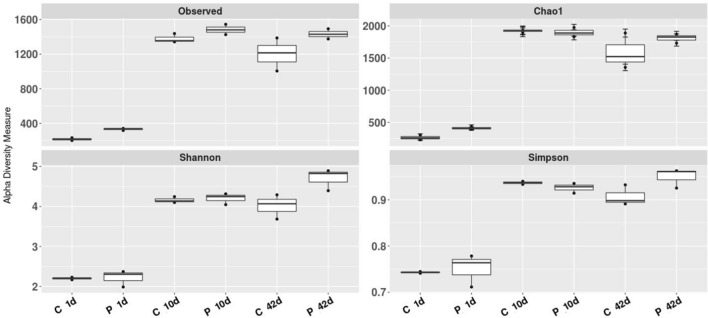
Fig. 1.
Comparative differences in bacterial community diversity, richness, and cecal microfloral structure of the P-group and C-group based on Observed OTUs, Chao1, Shannon and Simpson indices. C 1d, C 10d and C 42d correspond to—control group birds on days 1, 10 and 42, respectively. P 1d, P 10d and P 42d refer to probiotic group birds on days 1, 10 and 42, accordingly

