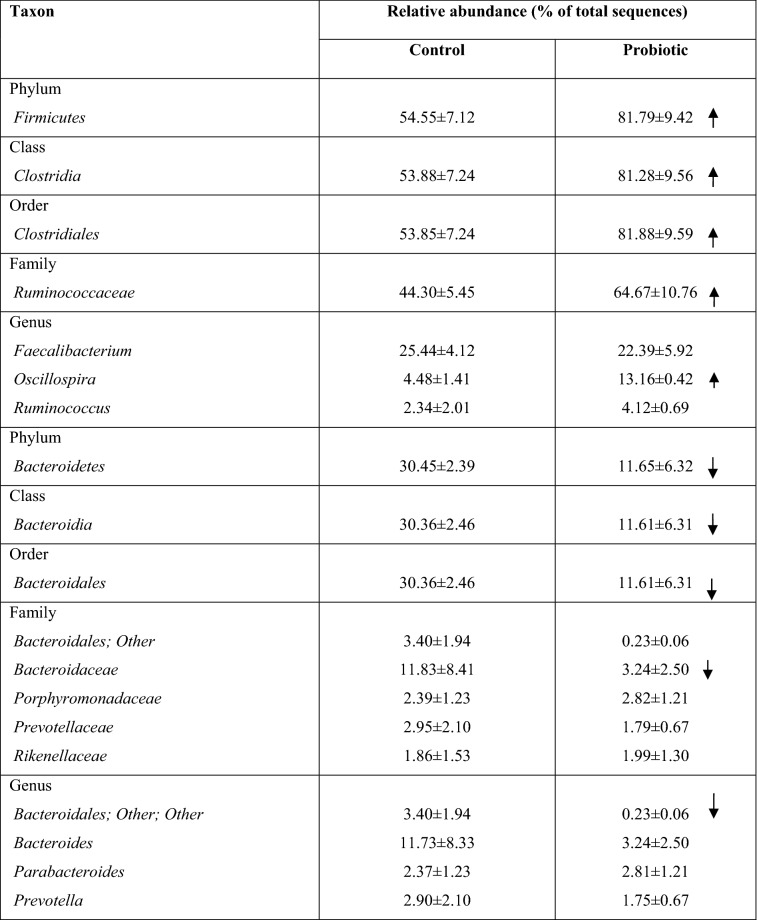
Table 3.
The relative abundance of the main bacterial taxa in the cecum of broiler chickens on day 42 and the effect of the probiotic B. subtilis GM5
Mean percentages and standard error (S.E.) of bacterial abundance observed from 18 samples
Arrows indicate an increase (
 ) or decrease (
 ) in the relative abundance (% of total sequence)

