
Figure 2.
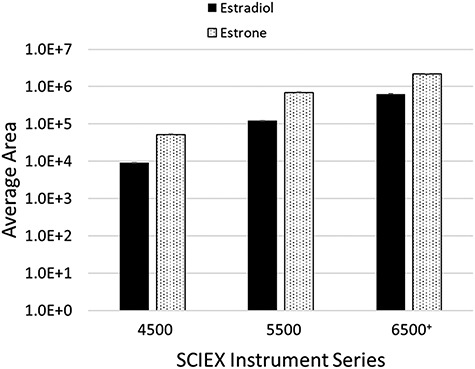
Average peak area obtained from SST samples run in duplicate across three different instrument platforms. Error bars represent 1 SEM.
Official websites use .gov
A
.gov website belongs to an official
government organization in the United States.
Secure .gov websites use HTTPS
A lock (
) or https:// means you've safely
connected to the .gov website. Share sensitive
information only on official, secure websites.
Average peak area obtained from SST samples run in duplicate across three different instrument platforms. Error bars represent 1 SEM.