Figure 7.

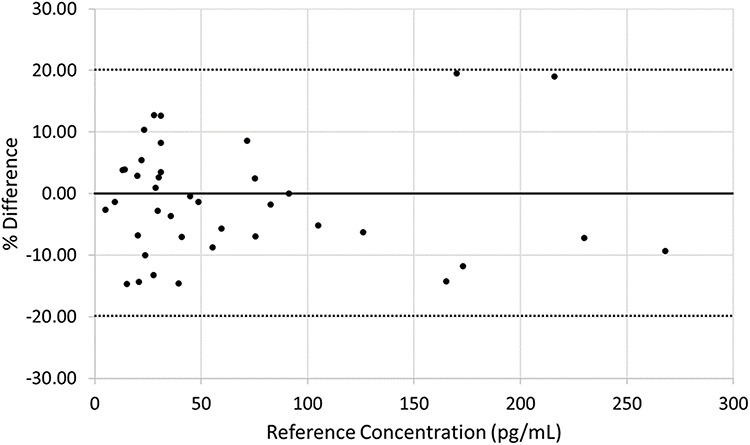
Bias plot for the estradiol accuracy study. The bold, solid line represents a percent difference of 0. The bold, dotted lines represent ±20% difference.

Bias plot for the estradiol accuracy study. The bold, solid line represents a percent difference of 0. The bold, dotted lines represent ±20% difference.