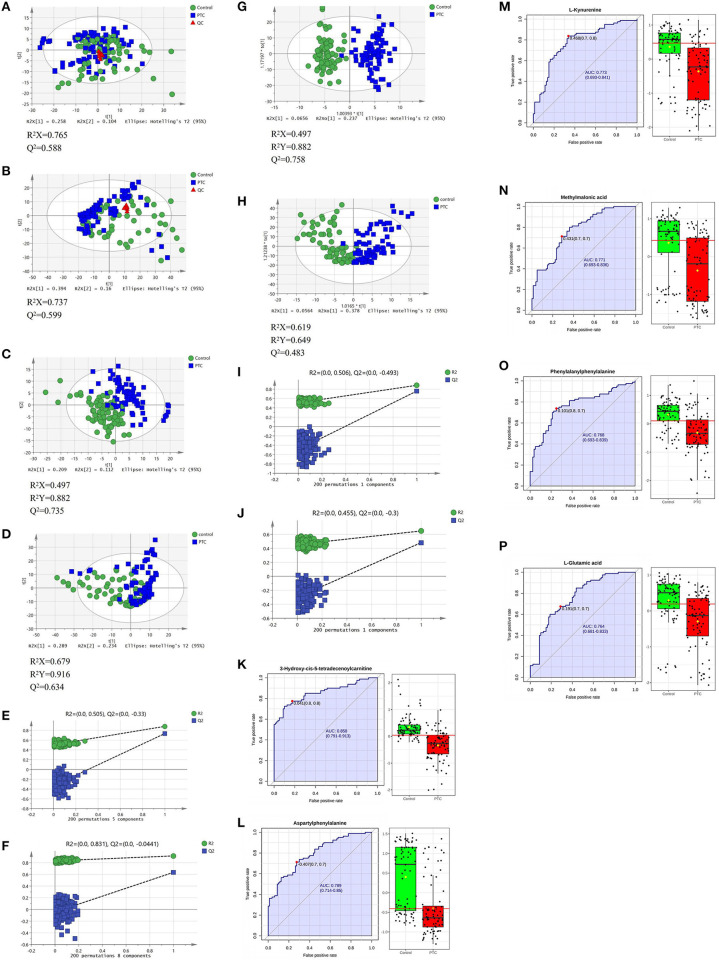
Figure 2.
PCA (A,B), PLS-DA (C,D), and OPLS-DA (G,H) analysis score scatter plots illustrating that the metabolic profiles of PTC are distinct from those of healthy subjects. PLS-DA and OPLS-DA analysis score scatter plots for metabolic profiles of healthy subjects (green dots) and PTC patients (blue squares) showing clear discrimination between the two groups. (E,F,I,J) Permutation test was used to assess the reliability of the models. ROC curve analyses of the ability of six metabolites to predict PTC patients and healthy subject (K–P). PCA, principal component analysis; PLS-DA, partial least squares discrimination analysis; OPLS-DA, orthogonal partial least squares-discriminant analysis; QC, Quality Control; PTC, papillary thyroid carcinoma; Control, healthy subject. ROC, receiver operating characteristic.

