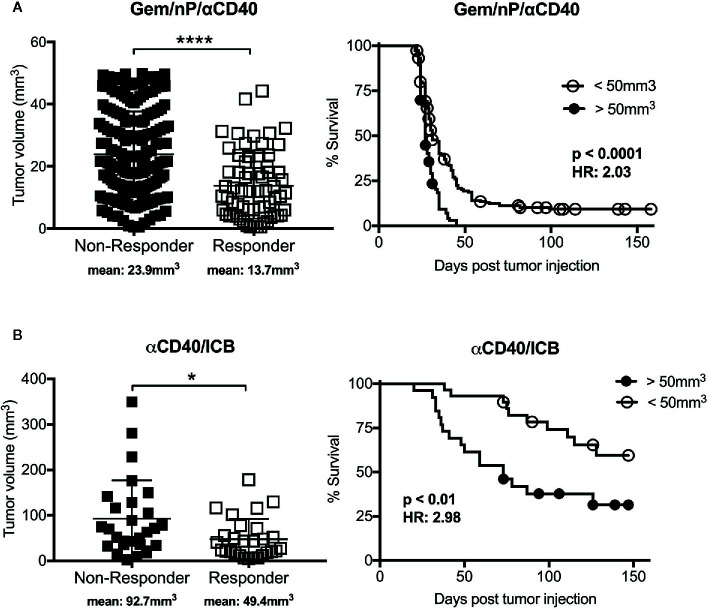
Figure 1.
Efficacy of tumor rejection after combination treatment with agonistic CD40 antibody correlates with tumor size. Graphs from studies reported in (66) (A) and (67) (B), reported here stratified by tumor response (defined as cured of primary tumor; scatter plots) or baseline tumor size (survival curves). Briefly, C57Bl/6 mice were implanted subcutaneously with 2.5x10⁵ 4,662 pancreatic ductal adenocarcinoma (PDAC) cell lines and treated with (A) agonistic CD40 (αCD40) in combination with chemotherapy (gemcitabine, Gem; and nab-paclitaxel, nP) as described in (66), or treated with (B) αCD40 in combination with αPD-1 and αCTLA-4 (ICB) as reported in (67). Each symbol represents a single mouse, horizontal lines indicate mean (also denoted below graph), and error bars indicate standard deviation. **** indicates p value < 0.0001 and * p < 0.05 as determined by an unpaired t test. For survival curves analysis was performed using log-rank test with indicated p values, HR indicates Hazard Ratio according to the size cutoff of 50mm3, calculated using log-rank. Analyses were performed using Graphpad Prism.

