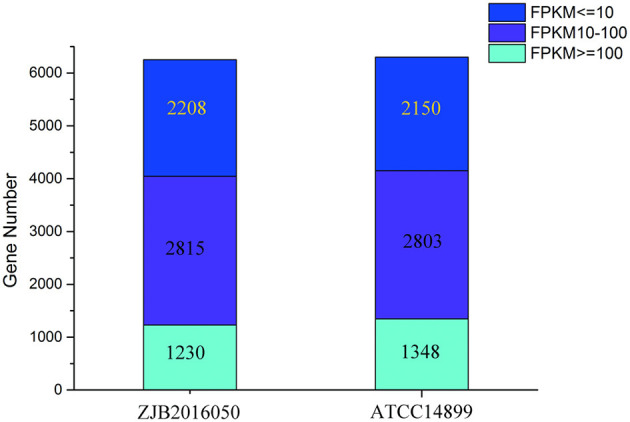
Figure 4.

The number distribution of genes with different expression levels in samples of S. nodosus ATCC14899 and S. nodosus ZJB2016050. Light blue represents genes with FPKM ≥ 100, purple represents genes with FPKM 10–100, and dark blue represents genes with FPKM ≤ 10.
