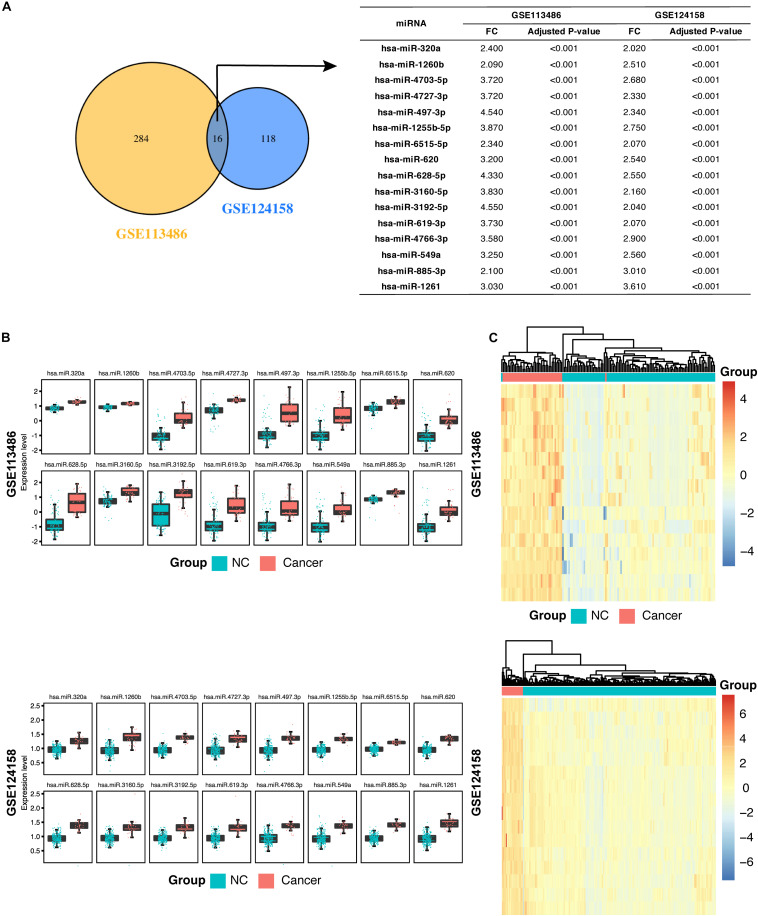
FIGURE 2.
Identification of 16 candidate serum miRNA signatures and their characterization in the discovery datasets. (A) Venn diagram showing significant differentially expressed (DE) miRNAs in the discovery dataset GSE113458 and GSE124158. The 16 miRNAs are listed in the table on the right along with the adjusted p-value and fold change. (B) Box plots showing higher expression levels of the 16 identified miRNAs in gastric cancer patients compared with the non-cancer control patients in GSE113486 and GSE124158. (C) Heatmap showing a promising result of the hierarchical clustering analysis using the 16 identified miRNAs to distinguish different samples in GSE113486 and GSE124158. NC, non-cancer control patients.

