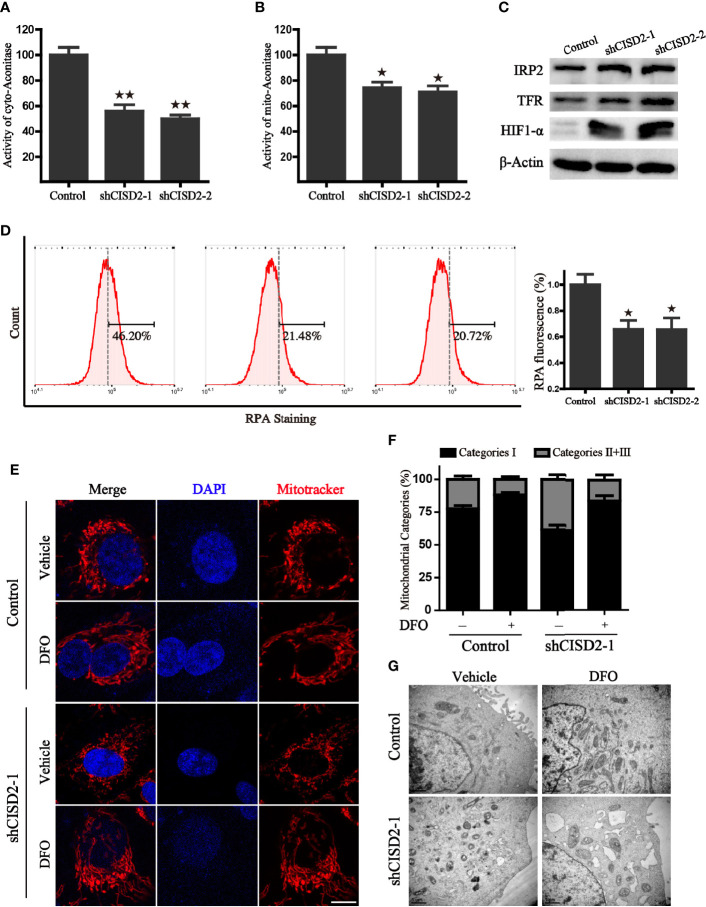
Figure 7.
CISD2 silencing accelerates iron accumulation in A549 cells. (A) The activity of cytoplasmic aconitase in CISD2 knockdown cells, **P < 0.01 vs. the control group. (B) The activity of mitochondrial aconitase in CISD2 knockdown cells, *P < 0.05 vs. the control group. (C) Protein levels of iron regulatory protein 2 (IRP2), transferrin receptor protein (TFR), and hypoxia-inducible factor 1-alpha (HIF1-α) in indicated A549 cells. β-Actin was used as the loading control. (D) Intracellular Fe2+ was measured by RPA staining and flow cytometry analysis. Representative images (left) and statistical graphs (right) are shown; *P < 0.05, compared to the control group. (E) The representative images of mitochondrial morphology. Control and CISD2 silenced A549 cells were treated with or without DFO (100 μM) for 12 h, then labeled with MitoTracker Red and subjected to a confocal microscope for the observation of changes in mitochondrial morphology. Scale bars: 5 µm. (F) Quantification of mitochondrial morphology alteration according to the classification of mitochondrial category I–III. (G) The morphological changes of mitochondria in control and CISD2 silenced cells were detected by transmission electron microscopy (TEM) in the presence or absence of DFO (100 μM) treatment. Comparable results were obtained in three independent experiments.

