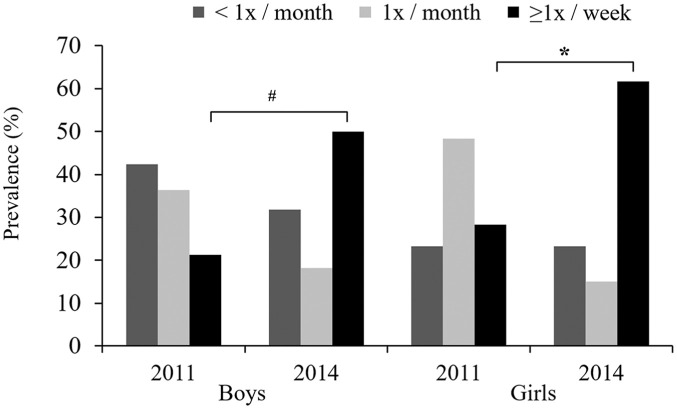
Figure 3.
Frequency of back pain in students at baseline (2011) and at the 3-year follow-up, stratified by sex – Teutônia, Rio Grande do Sul, Brazil. #Frequency increase in the response group ‘⩾1 time per week’ from 2011 to 2014 for boys (McNemar test, p = 0.002) and *frequency increase in the response group ‘⩾1 time per week’ from 2011 to 2014 for girls (McNemar test, p = 0.001).

